PolyField Server
The field-events control server. One desktop app runs the competition on your venue network: it holds the events and athletes, receives results live from the PolyField field app, drives the live display screens, records wind, produces statistics and social-media graphics, and (optionally) publishes results to the cloud. Runs on Windows and Mac; works on a local network.
- PolyField Server
- Overview
- How it works
- Getting started
- The dashboard
- Importing events
- Results & the field app
- Display screens
- Wind gauges
- Statistics & heatmaps
- Social-media graphics
- Cloud results - In Trial
- Competition link
- Settings, display size & language
- Networking
- Diagnostics
- Troubleshooting
- API reference
- Download & support
- API integration
Overview
PolyField Server is the hub of a field-events competition. It runs on one computer on your venue network and does four things at once:
-
Holds the competition — the events, age groups, athletes and every attempt, all stored locally on the host computer.
-
Receives results — officials measure at the circle or runway with the PolyField field app (on an Android device linked to an EDM total station or entered by hand), and the app posts each mark straight to the server.
-
Drives the displays — it serves a set of web pages that any screen on the network opens in a browser: a live results board, event standings, an announcer feed and para-athletics RAZA rankings.
-
Adds analysis — wind capture, per-event statistics and landing heatmaps, social-media graphics, and optional publishing to the PolyField cloud.
Everything runs on the local network — no internet is required to run a competition but is required to allow start list downloads from competition management providers and upload of real time results back to their systems. A sync is possible post-fixture to upload all results in bulk.
Positive validation. The server never invents results — every mark comes from an official through the field app. That keeps a clear chain from the measurement at the circle to what appears on the board.
How it works
-
You run one instance of the desktop app on a computer on the competition network.
-
The field app (one per event) connects to the server, downloads the athletes for its event, and posts each attempt back as it is measured.
-
Each display screen opens one of the server’s web pages in a browser; results update instantly with no need to refresh.
-
The operator works from the desktop dashboard — importing events, monitoring progress, exporting statistics and graphics, and managing displays and wind gauges. These are usually setup once at the start of a competition with no interaction needed through the day.
Getting started
1. Load a competition
Open the app; the Dashboard is the operator’s home. Start a competition one of three ways:
-
Import from OpenTrack or Athletics.app — pull the event list and start lists directly (see Importing events). This is the usual route and preserves the published start-list order.
-
Create events manually — use + Create New Event and add athletes.
-
New Competition — clears the current data to start fresh.
Once loaded, each event appears as a card on the dashboard showing its status (Not Started, In Progress, Finished).
2. Connect the field app
On each field device verify the server address in the PolyField field app to connect it to the server. The official then selects their event, calibrates the EDM to the circle or runway, and starts measuring. See Results & the field app.
3. Open the displays
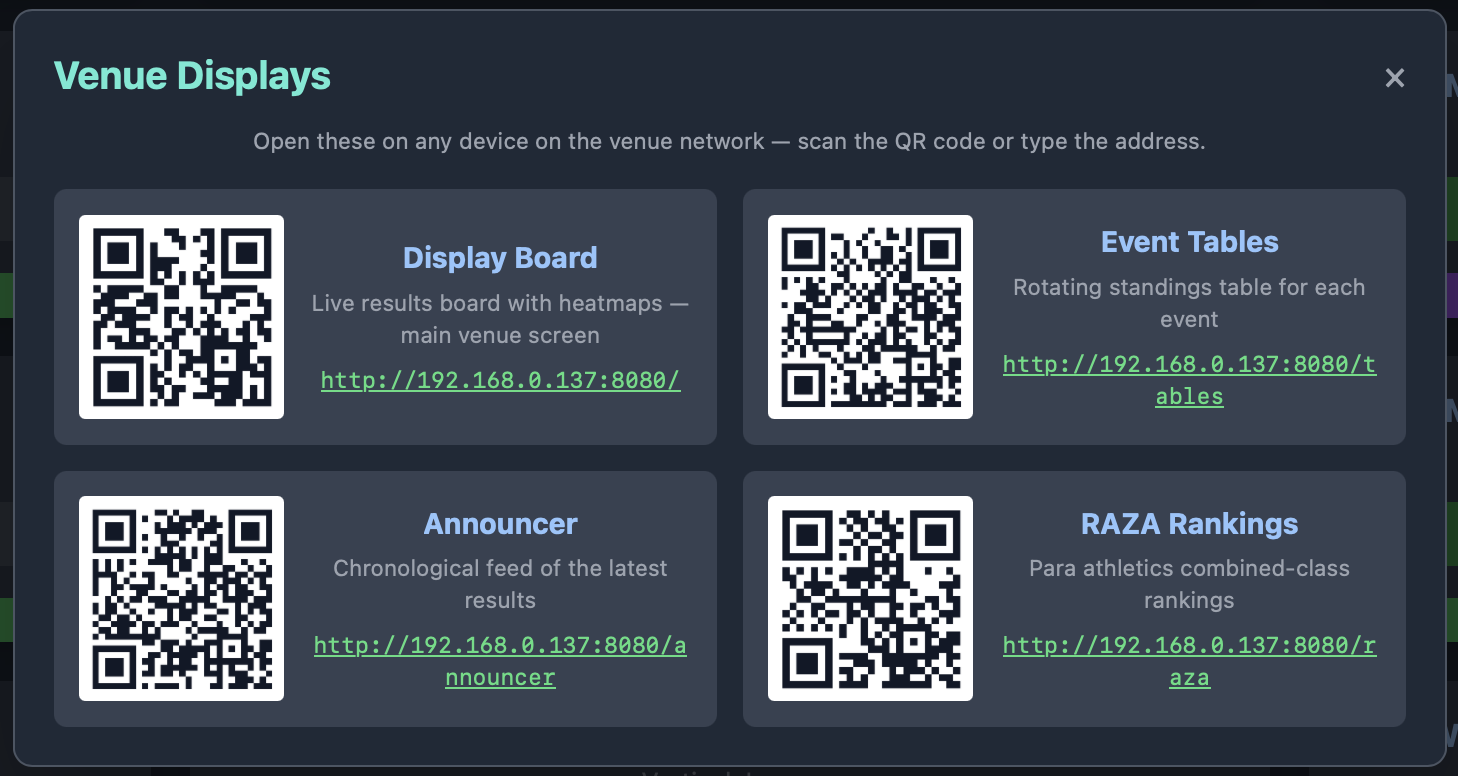
On each display device, open a browser at the server address and add the page you want — for example http://polyfieldserver.local:8080/tables. Use Displays on the dashboard for one-click links and scannable QR codes to every screen. See Display screens.
Tip. Leave the desktop app on the dashboard and drive everything from there. Results flow in from the field app automatically while you keep an eye on progress and the screens.
The dashboard
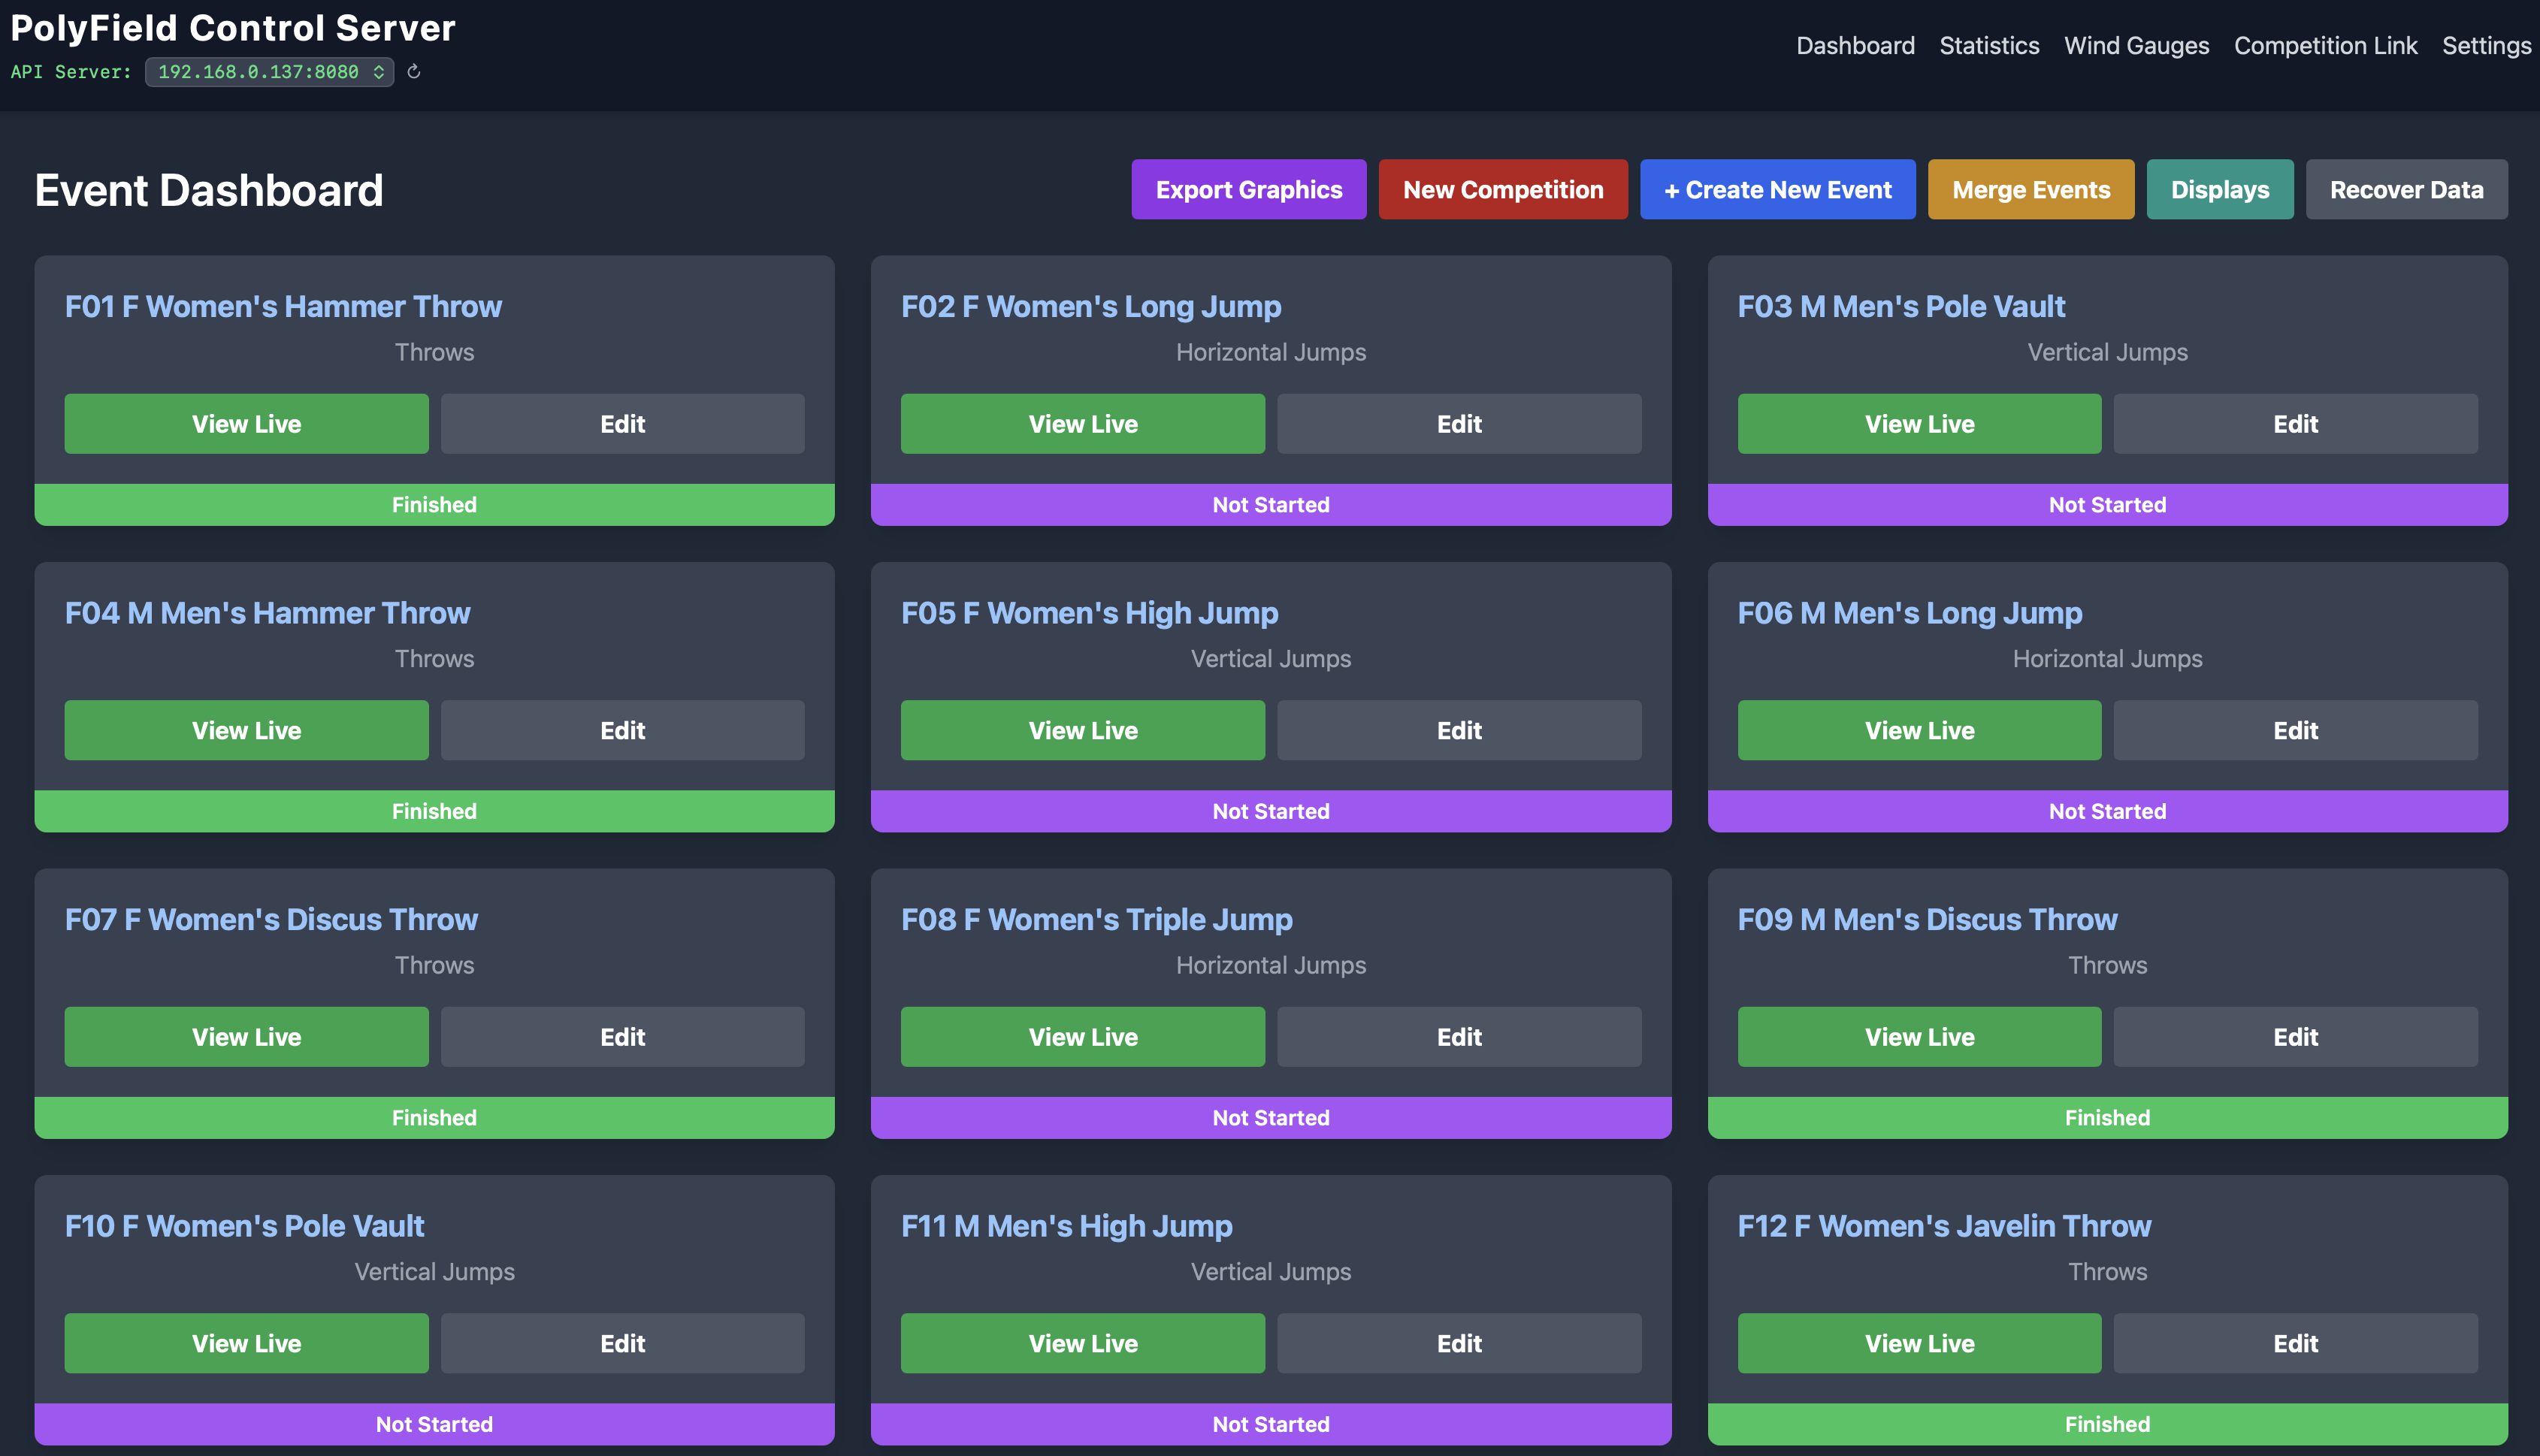
The dashboard lists every event and gives the main controls. Along the top is the server address (with a network selector on multi-adapter machines) and any pending upload or sync status. The key actions:
| Control | What it does |
|---|---|
| New Competition | Clear the current competition and start fresh. |
| Create New Event | Add an event and its athletes by hand. |
| Merge Events | Combine events (e.g. two groups of the same discipline) into one, or Merge All Same Events to combine every matching pair at once. |
| Displays | Show clickable links and QR codes for every display page (board, standings, announcer, RAZA). |
| Export Graphics | Generate the social-media graphics, detailed heatmaps and wind graphics for the competition (see Social-media graphics). |
| Export Statistics | Produce the competition statistics PDF (also on the Statistics page). |
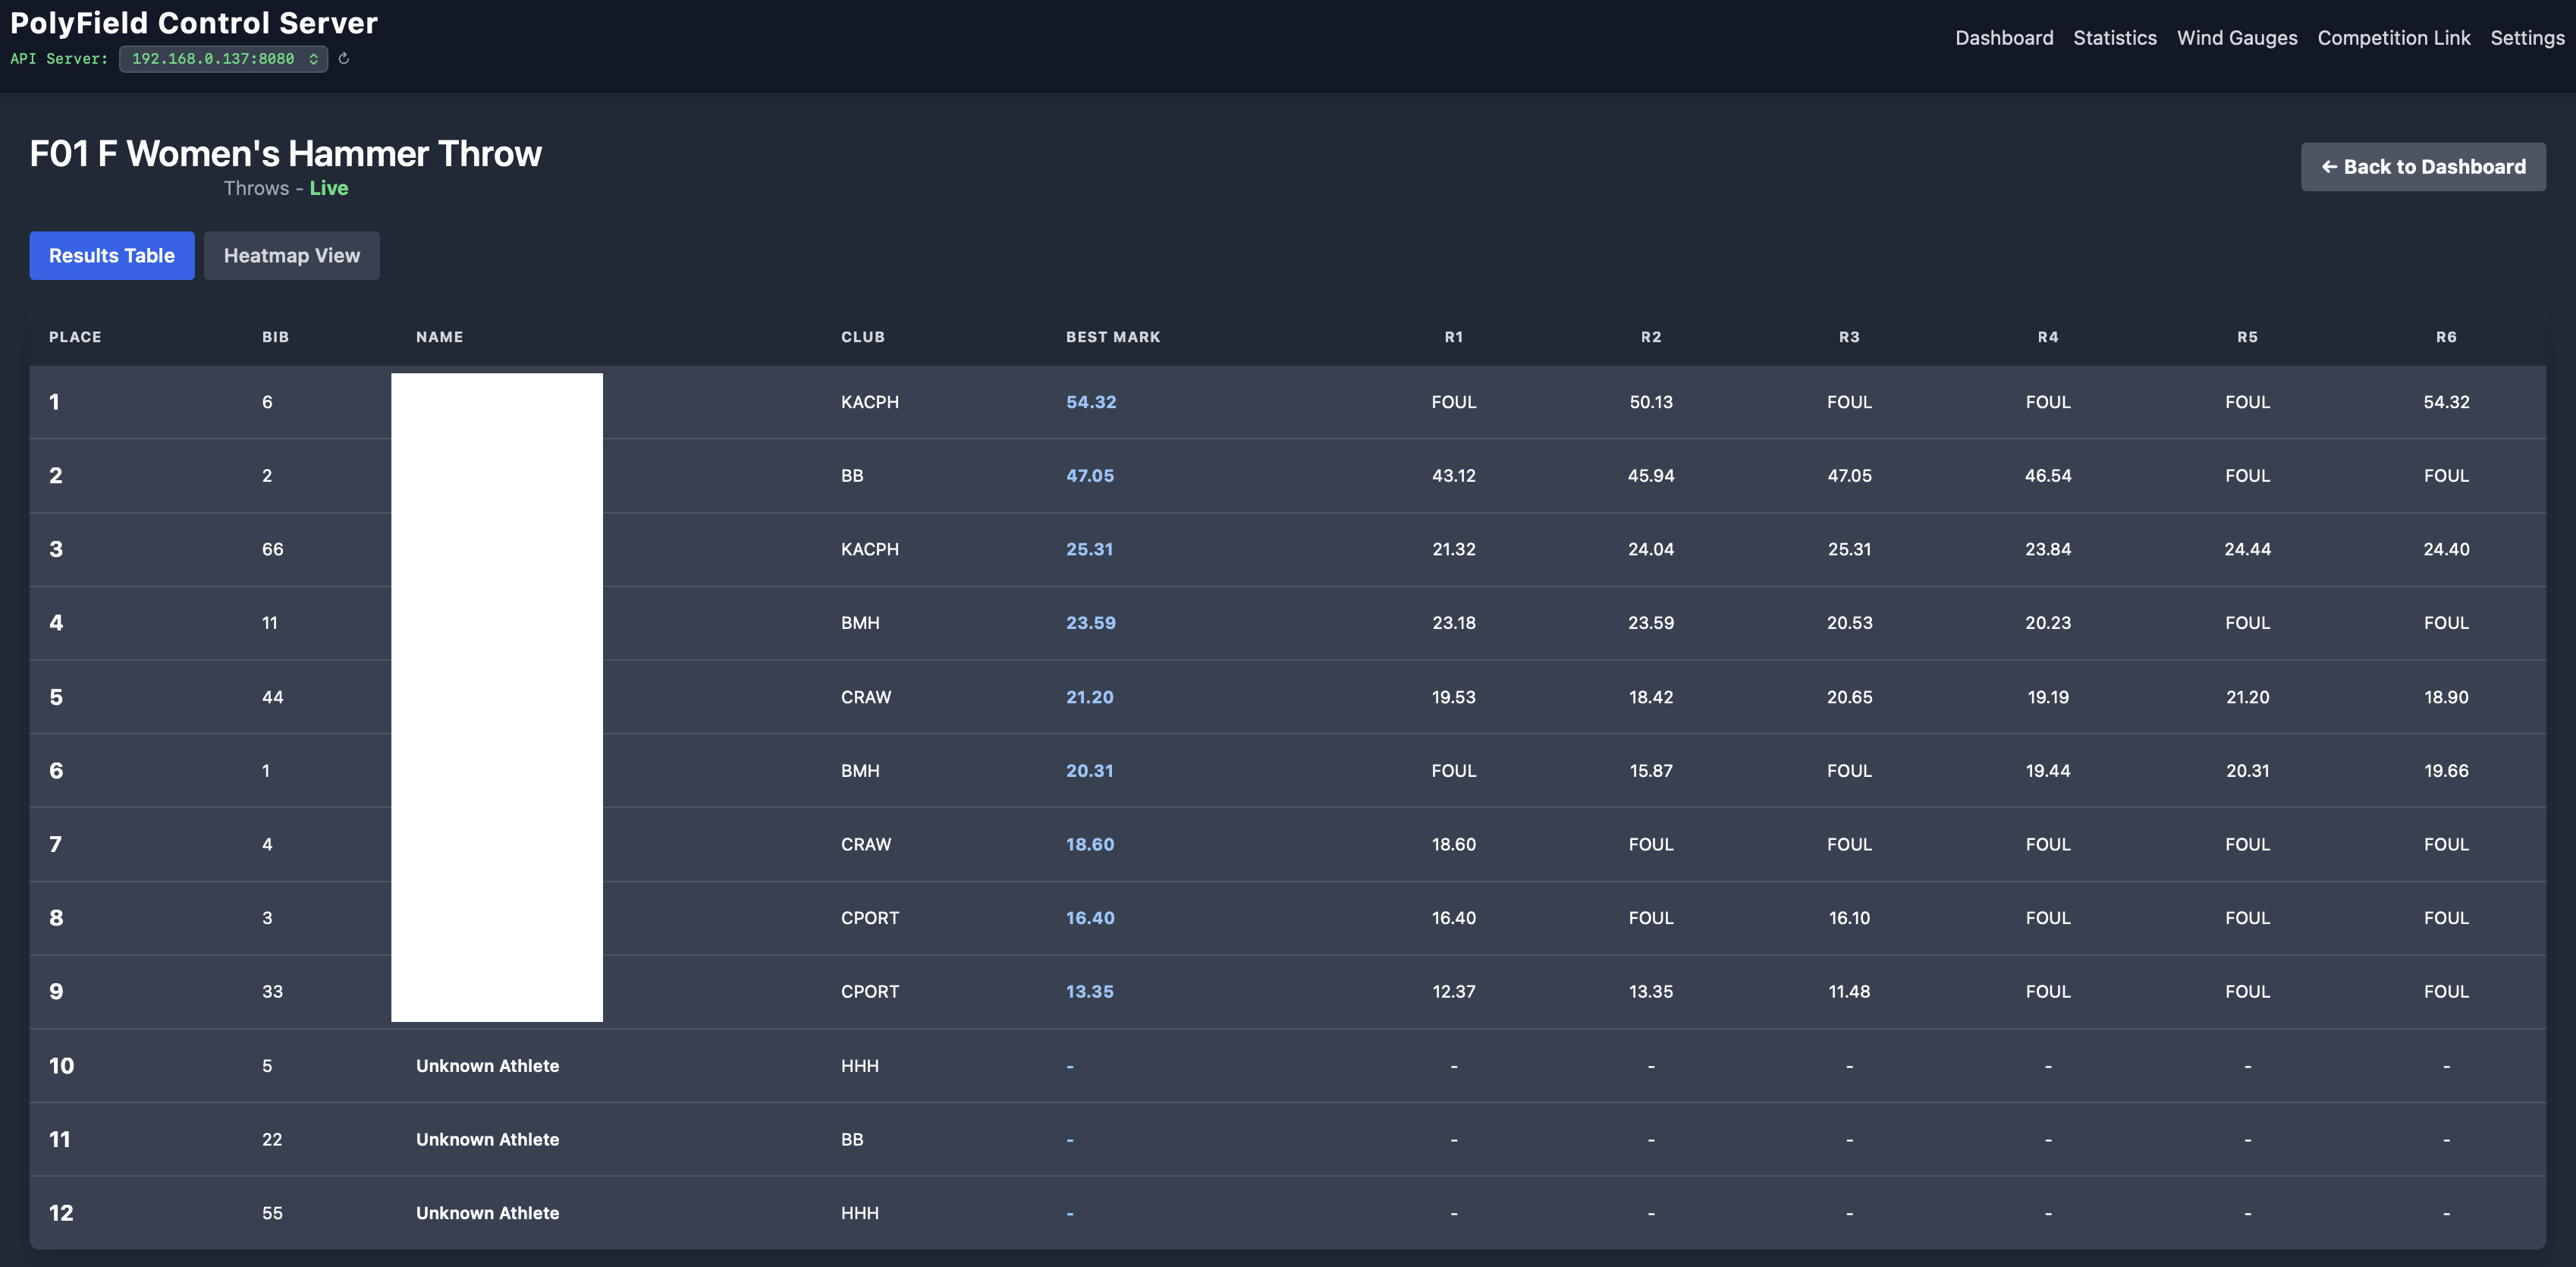
Selecting an event opens its Live Results view, where you can see each athlete’s series, watch attempts arrive, and review the standing.
Importing events
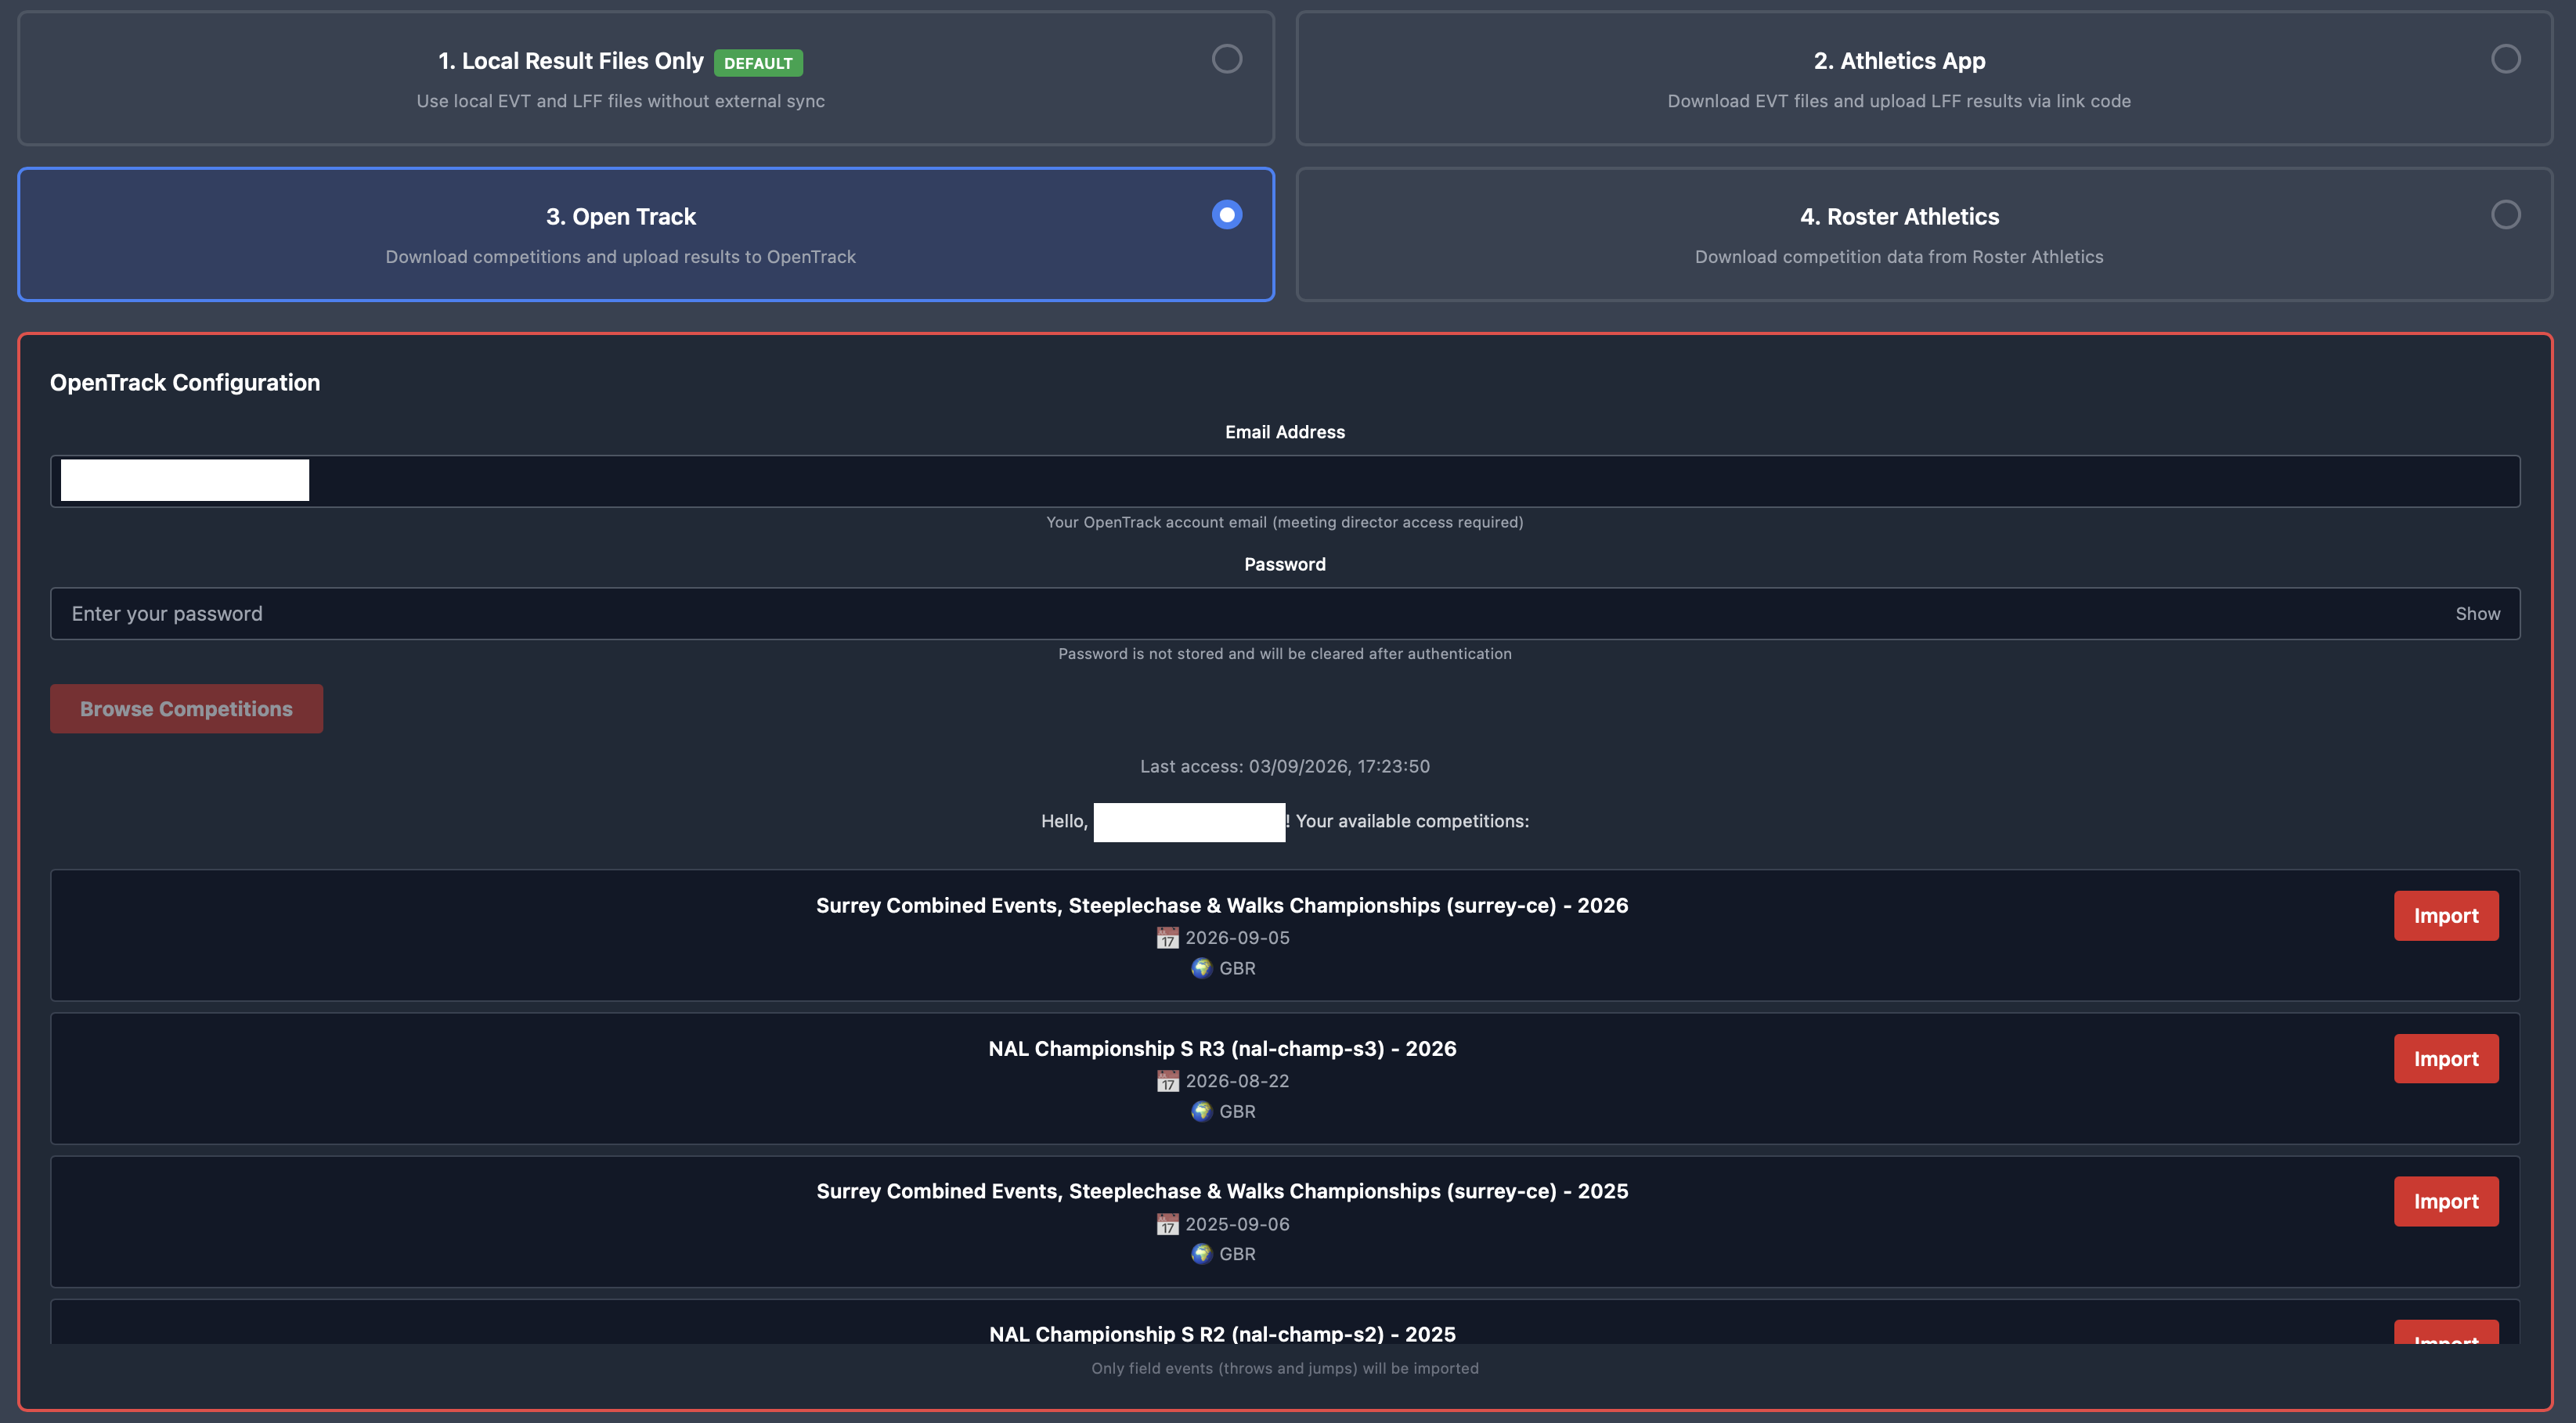
Use Competition Link / import to bring in a competition rather than typing it:
-
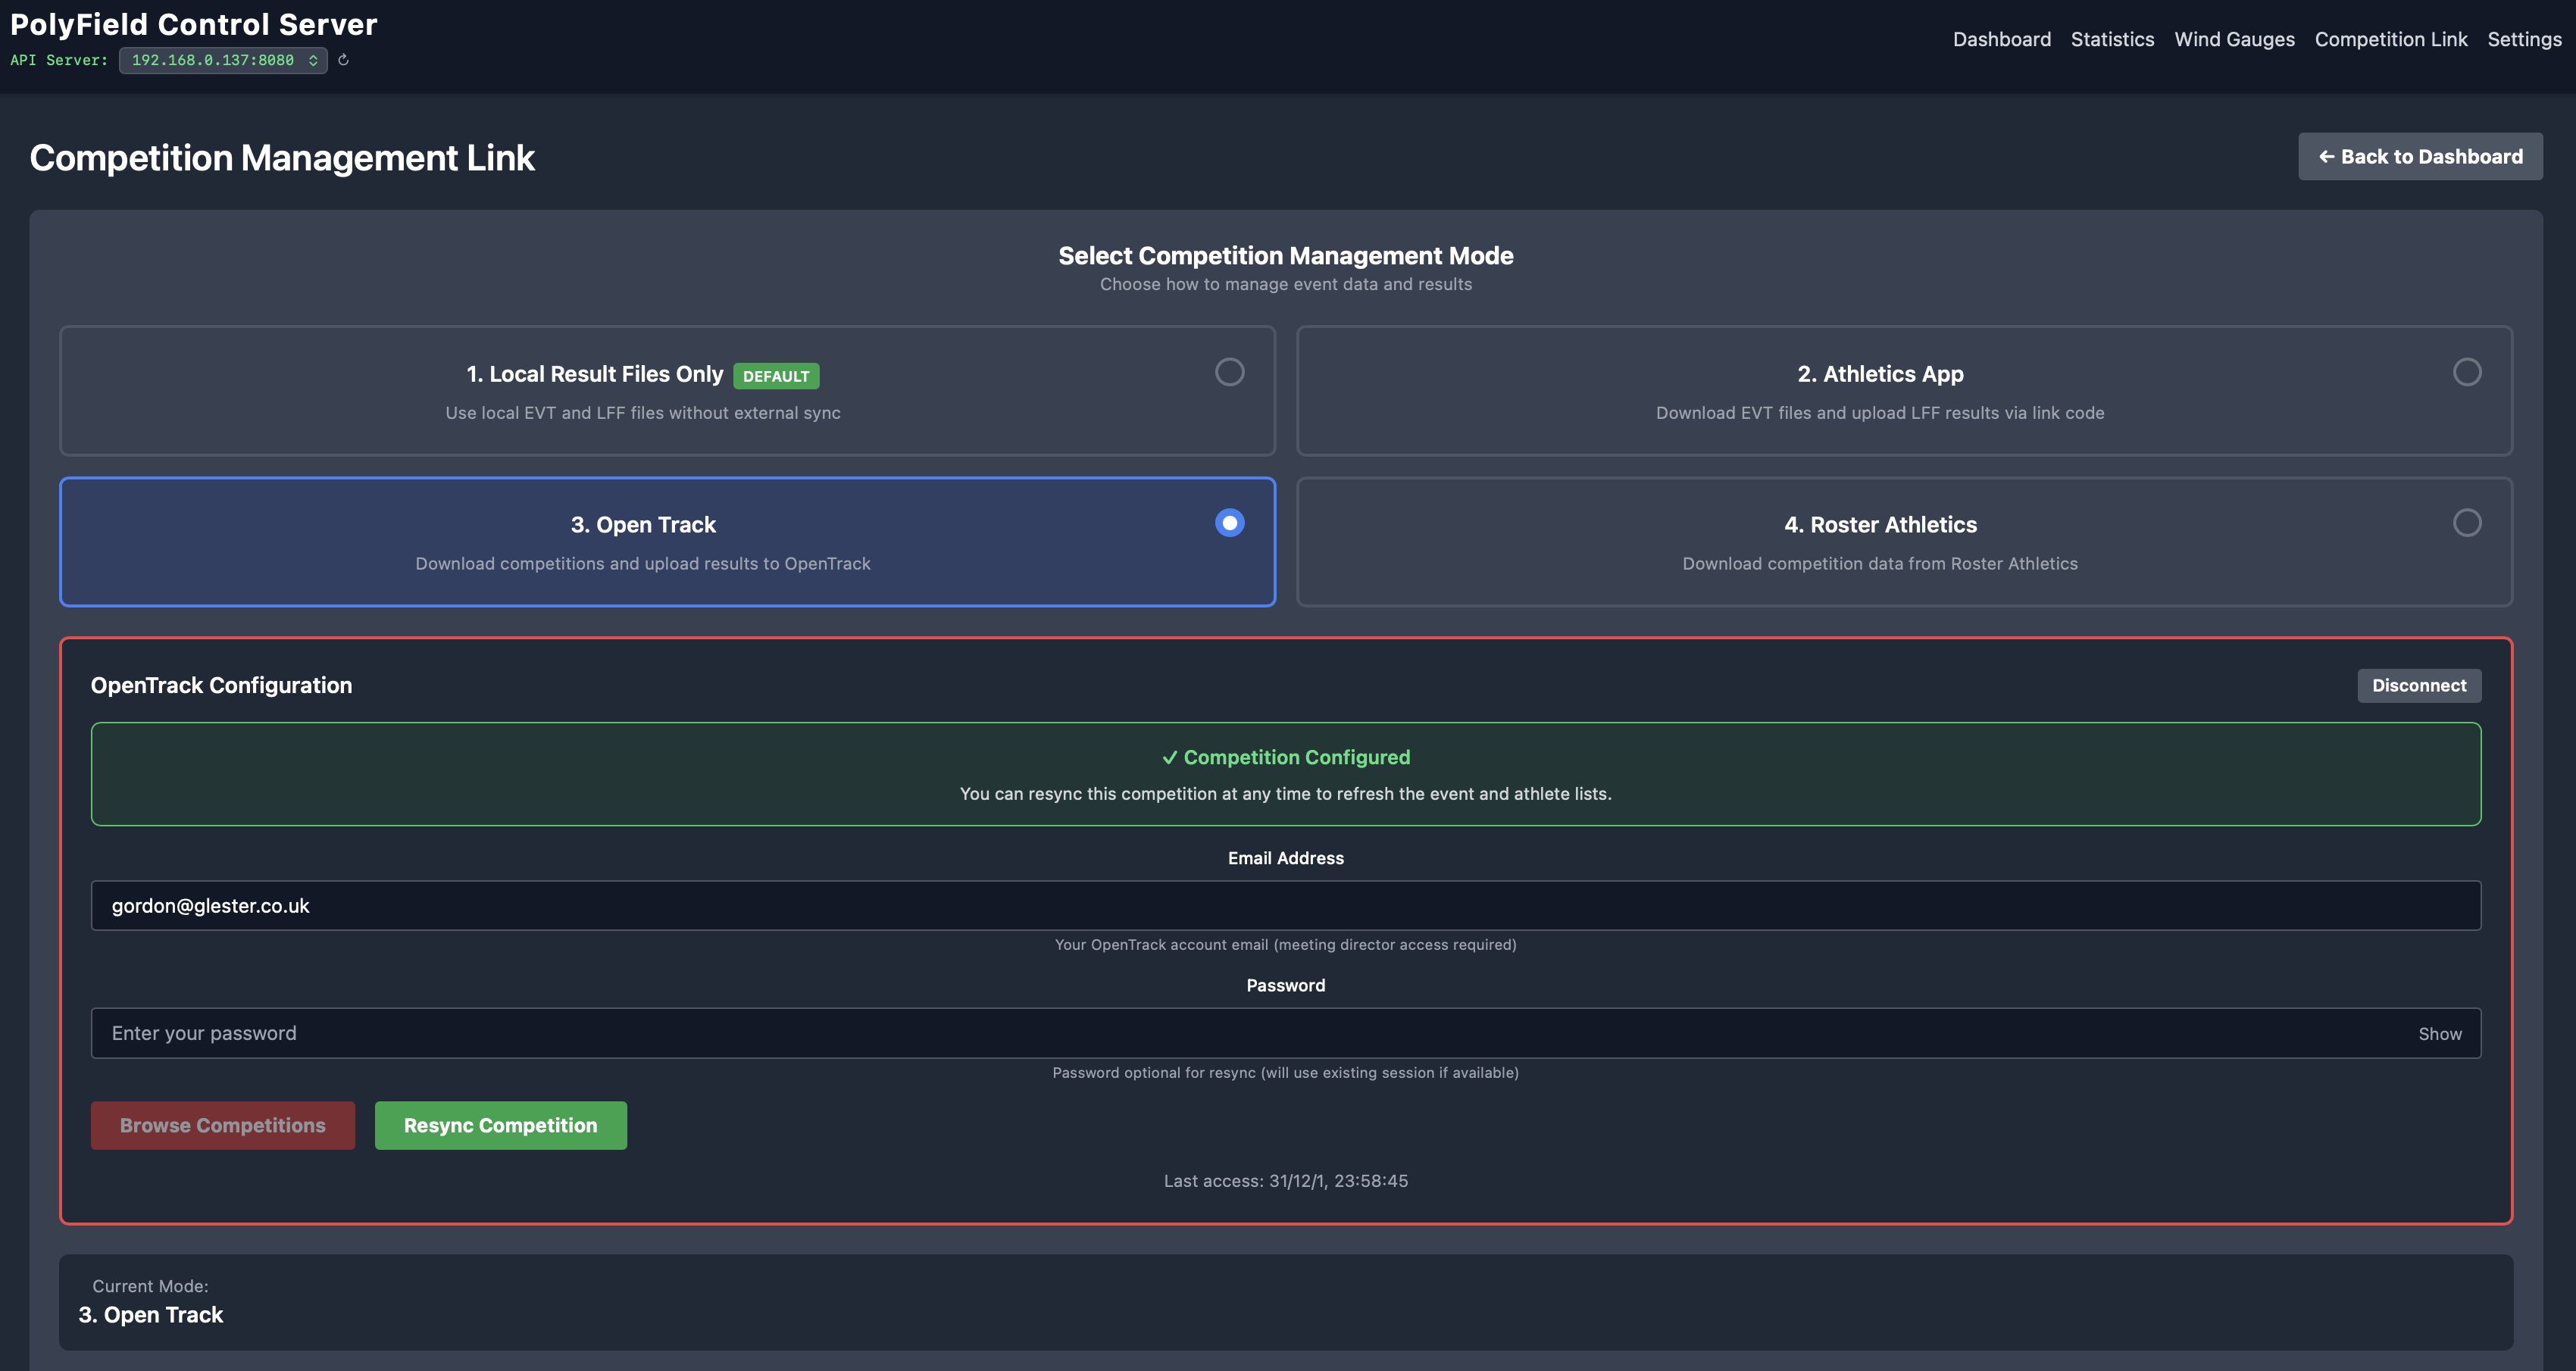
OpenTrack — sign in and choose your competition; the server downloads the field events and their entries. The start-list order published by OpenTrack is preserved exactly.
-
Athletics.app — input the competition link code to create the events and athletes. The start-list order published by Athletics.app is preserved exactly.
Imported events keep their source numbering and codes, so they line up with the published programme and with results export.
Results & the field app
Results are recorded on the field, not on the server. Each event uses the PolyField field app on an Android device:
-
The device connects to the server and downloads the athletes for the chosen event.
-
For throws and horizontal jumps the app can be paired with an EDM total station or run directly on a PolyField Total Station (PolyField APEKS AM02i); the official calibrates to the circle/runway/boards and each measured mark (with landing coordinate) is posted to the server. Marks can also be entered by hand.
-
Vertical jumps (high jump, pole vault) are fully supported — heights, clearances (O/X) and the bar progression are recorded and sent.
-
Every attempt carries its own timestamp, so the server shows results in the true order they happened and can produce accurate timing statistics.
As results arrive the event’s card updates, the standings recalculate, and any connected display refreshes instantly.
Display screens
The server serves four live display pages. Each is a normal web page — open it in any browser on the network; nothing is installed on the display. They all update automatically: new results are pushed the moment they land, with a periodic poll as a safety net, so a screen never needs a manual refresh.
| Page | URL |
|---|---|
| Display board (latest results) | / |
| Event standings (tables) | /tables |
| Announcer feed | /announcer |
| RAZA rankings (para-athletics) | /raza |
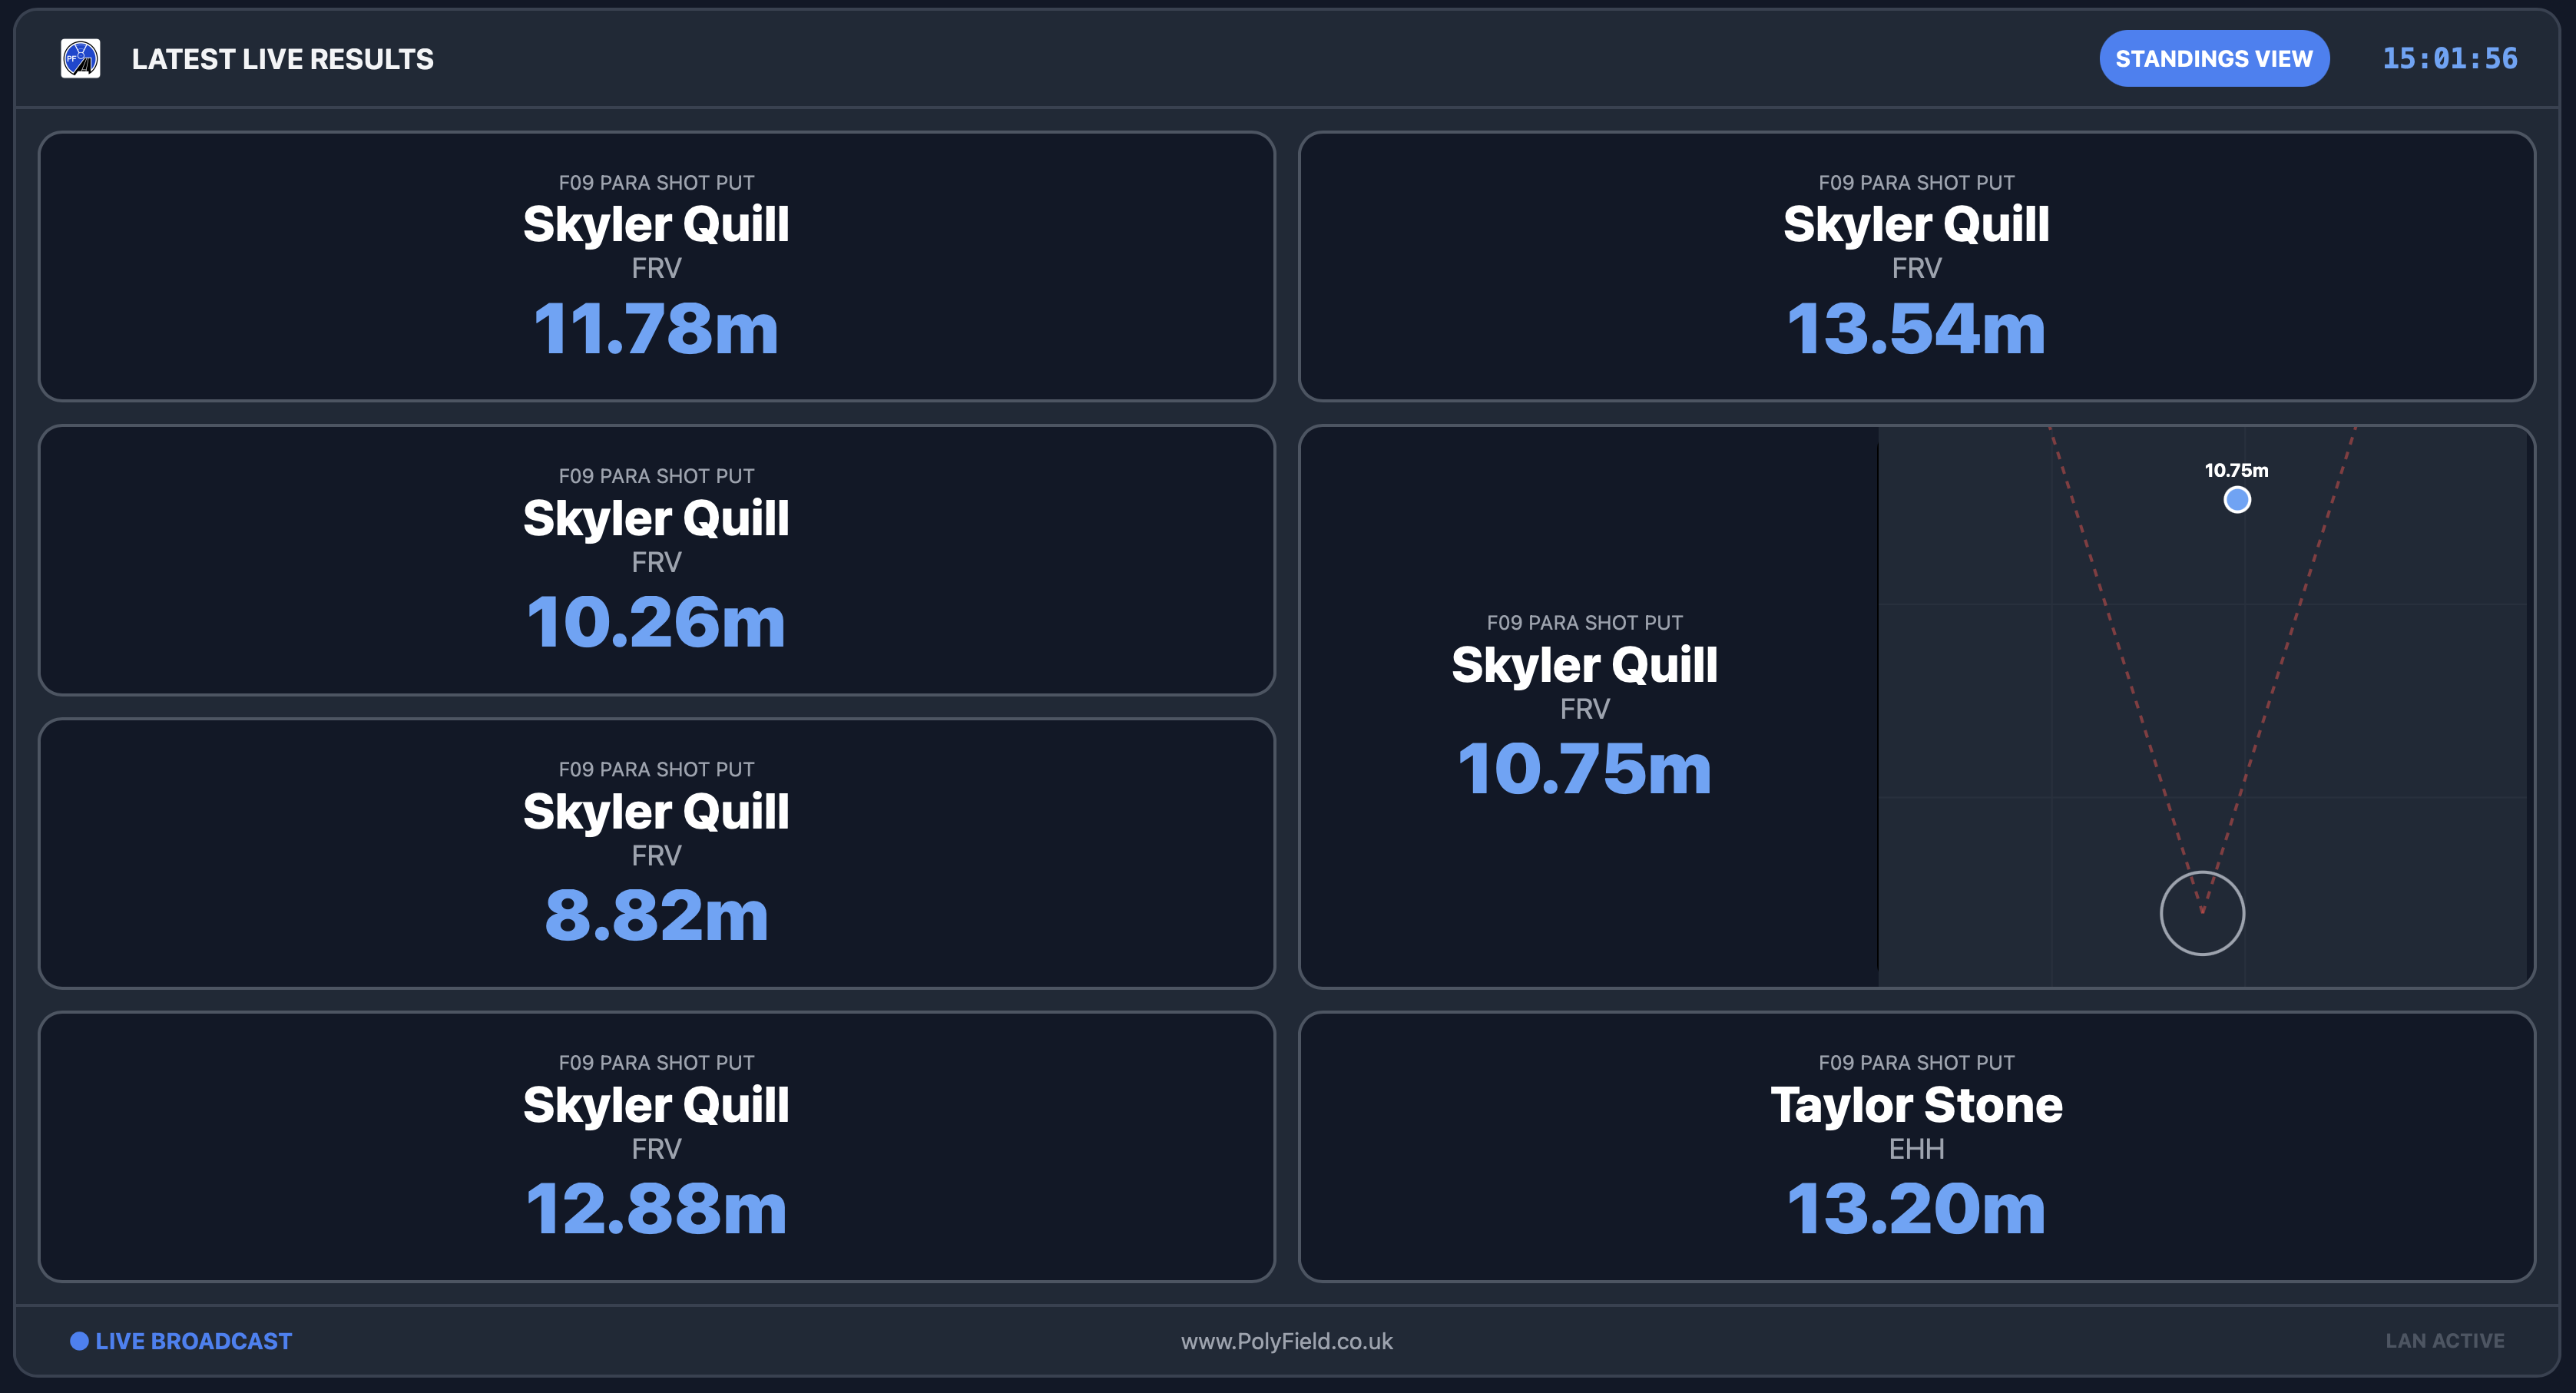
Display board
A big-screen board of the most recent performances, with the athlete, event, mark and — for throws — a landing visualisation. Ideal as the main results screen for spectators.
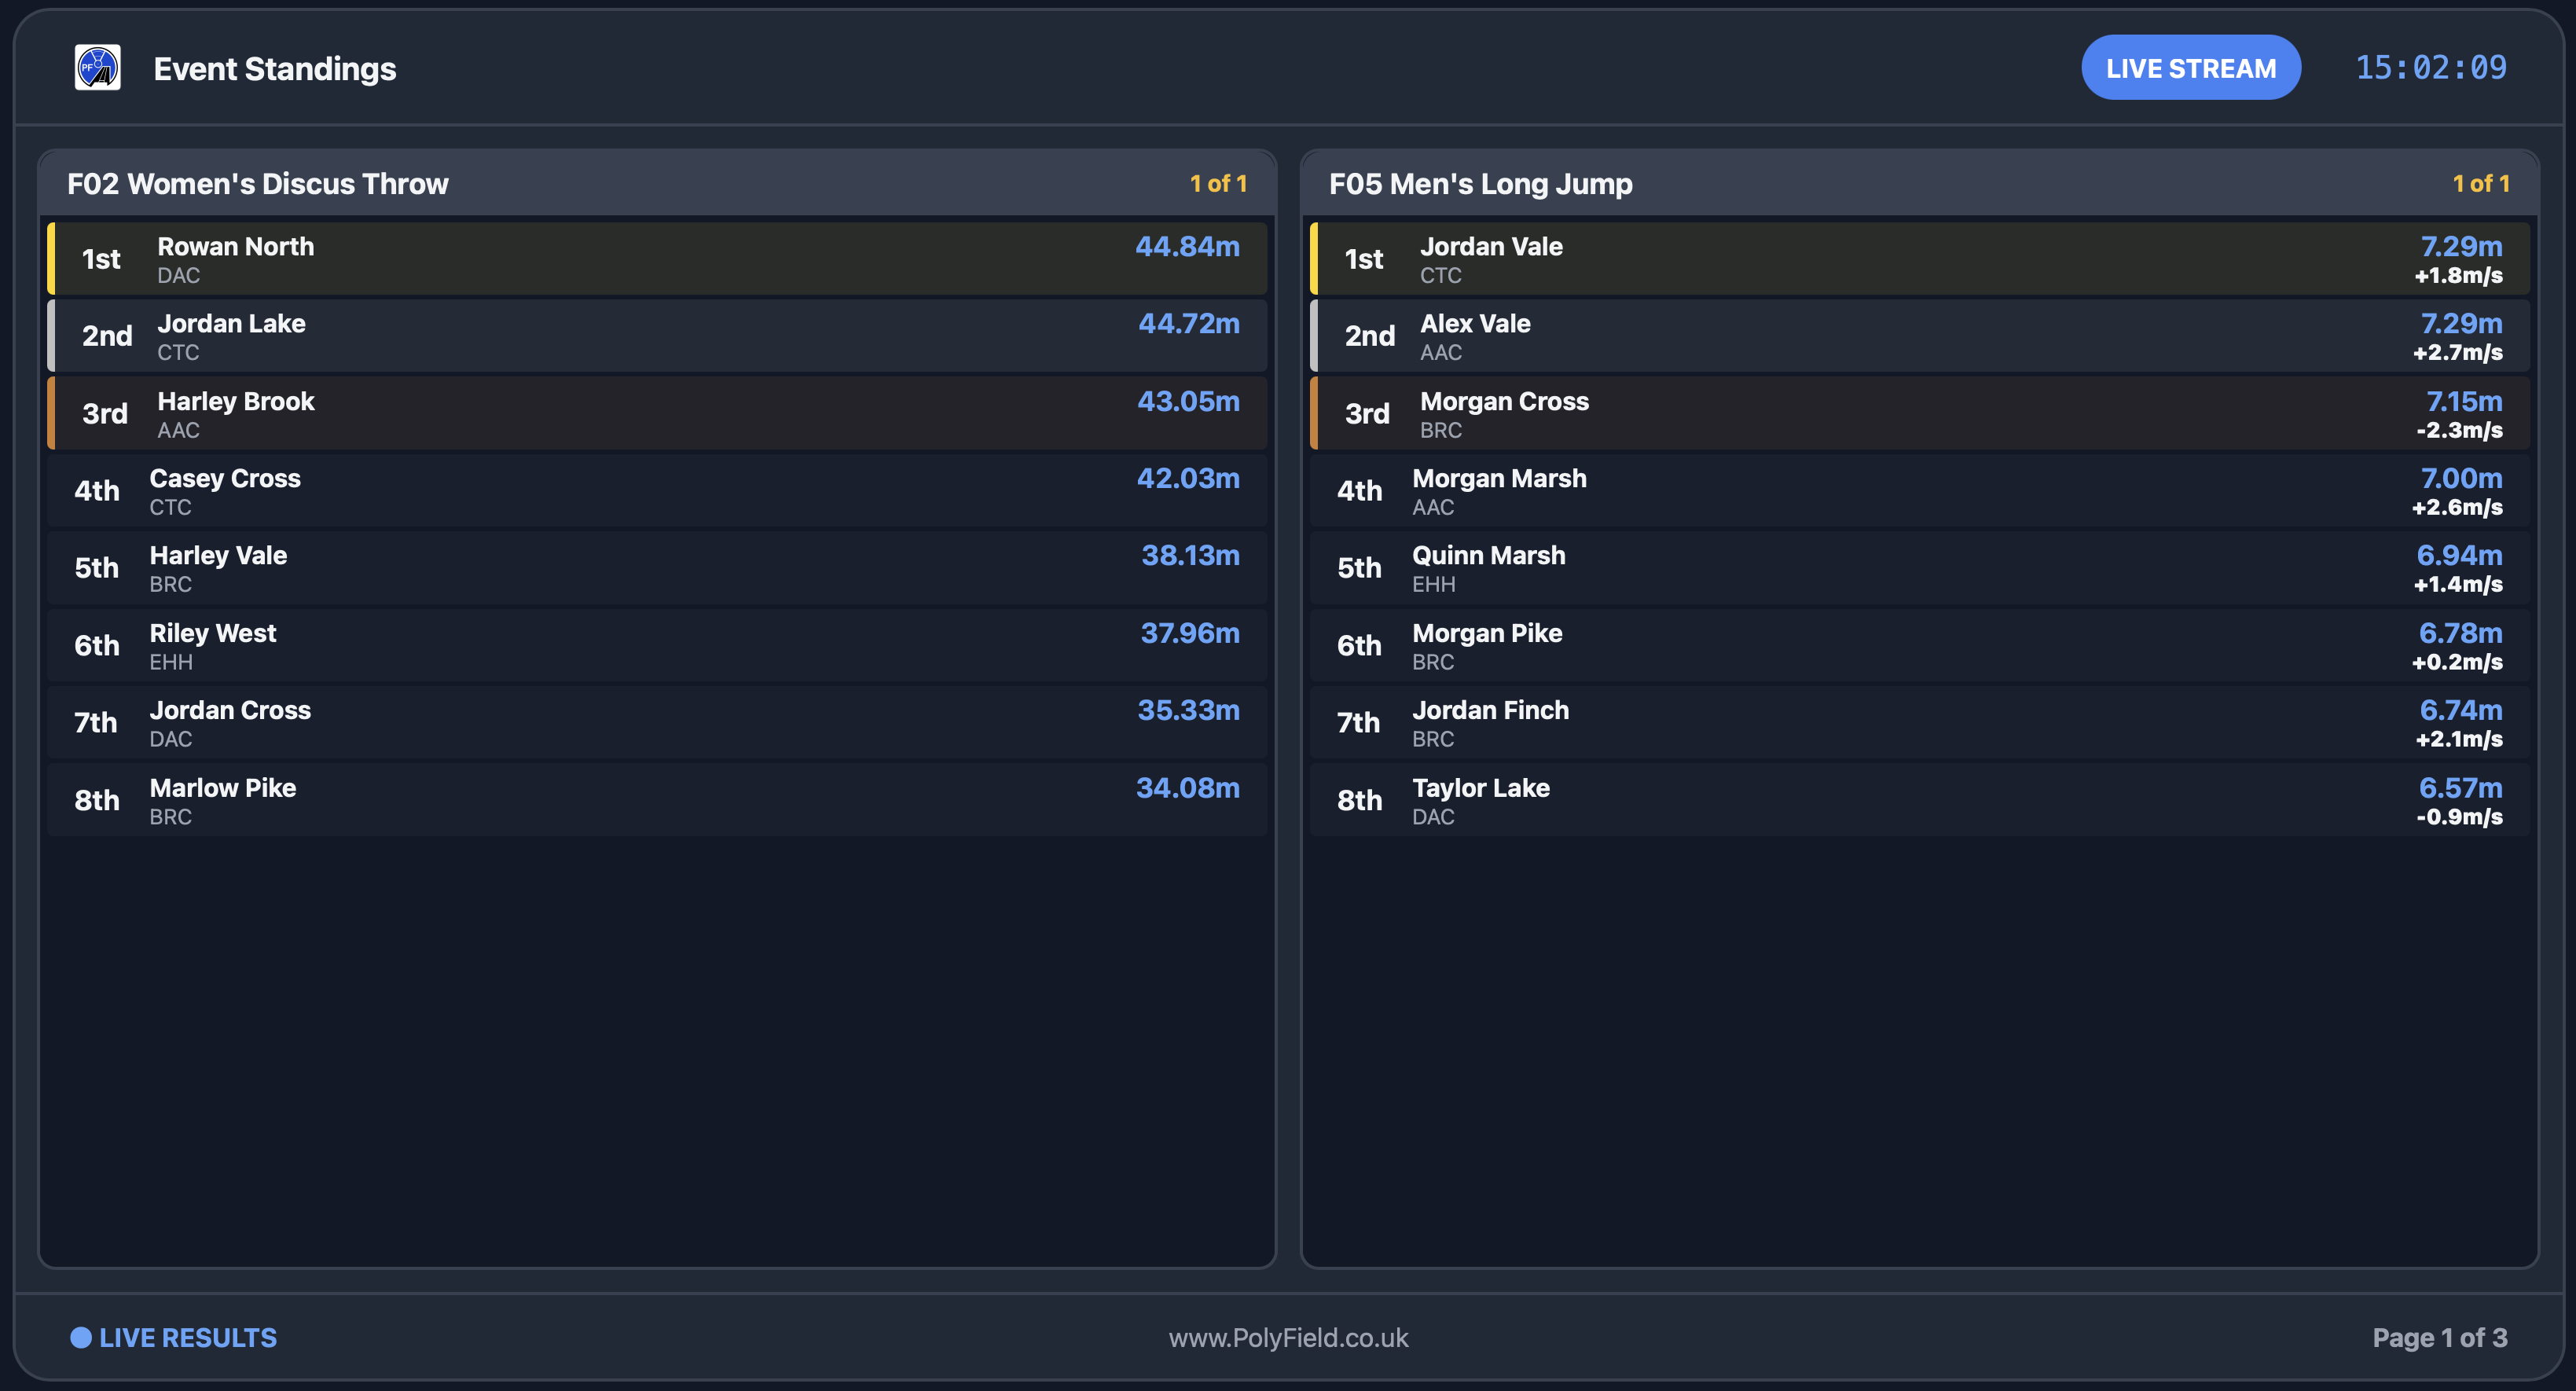
Event standings
Live standings, several events at a time, each ranked with gold/silver/bronze highlights. The layout is height-aware: it fills the screen, stacks more events down tall or portrait screens, and where an event has many athletes it rotates through them page by page. Events also rotate so every event on the programme gets screen time.
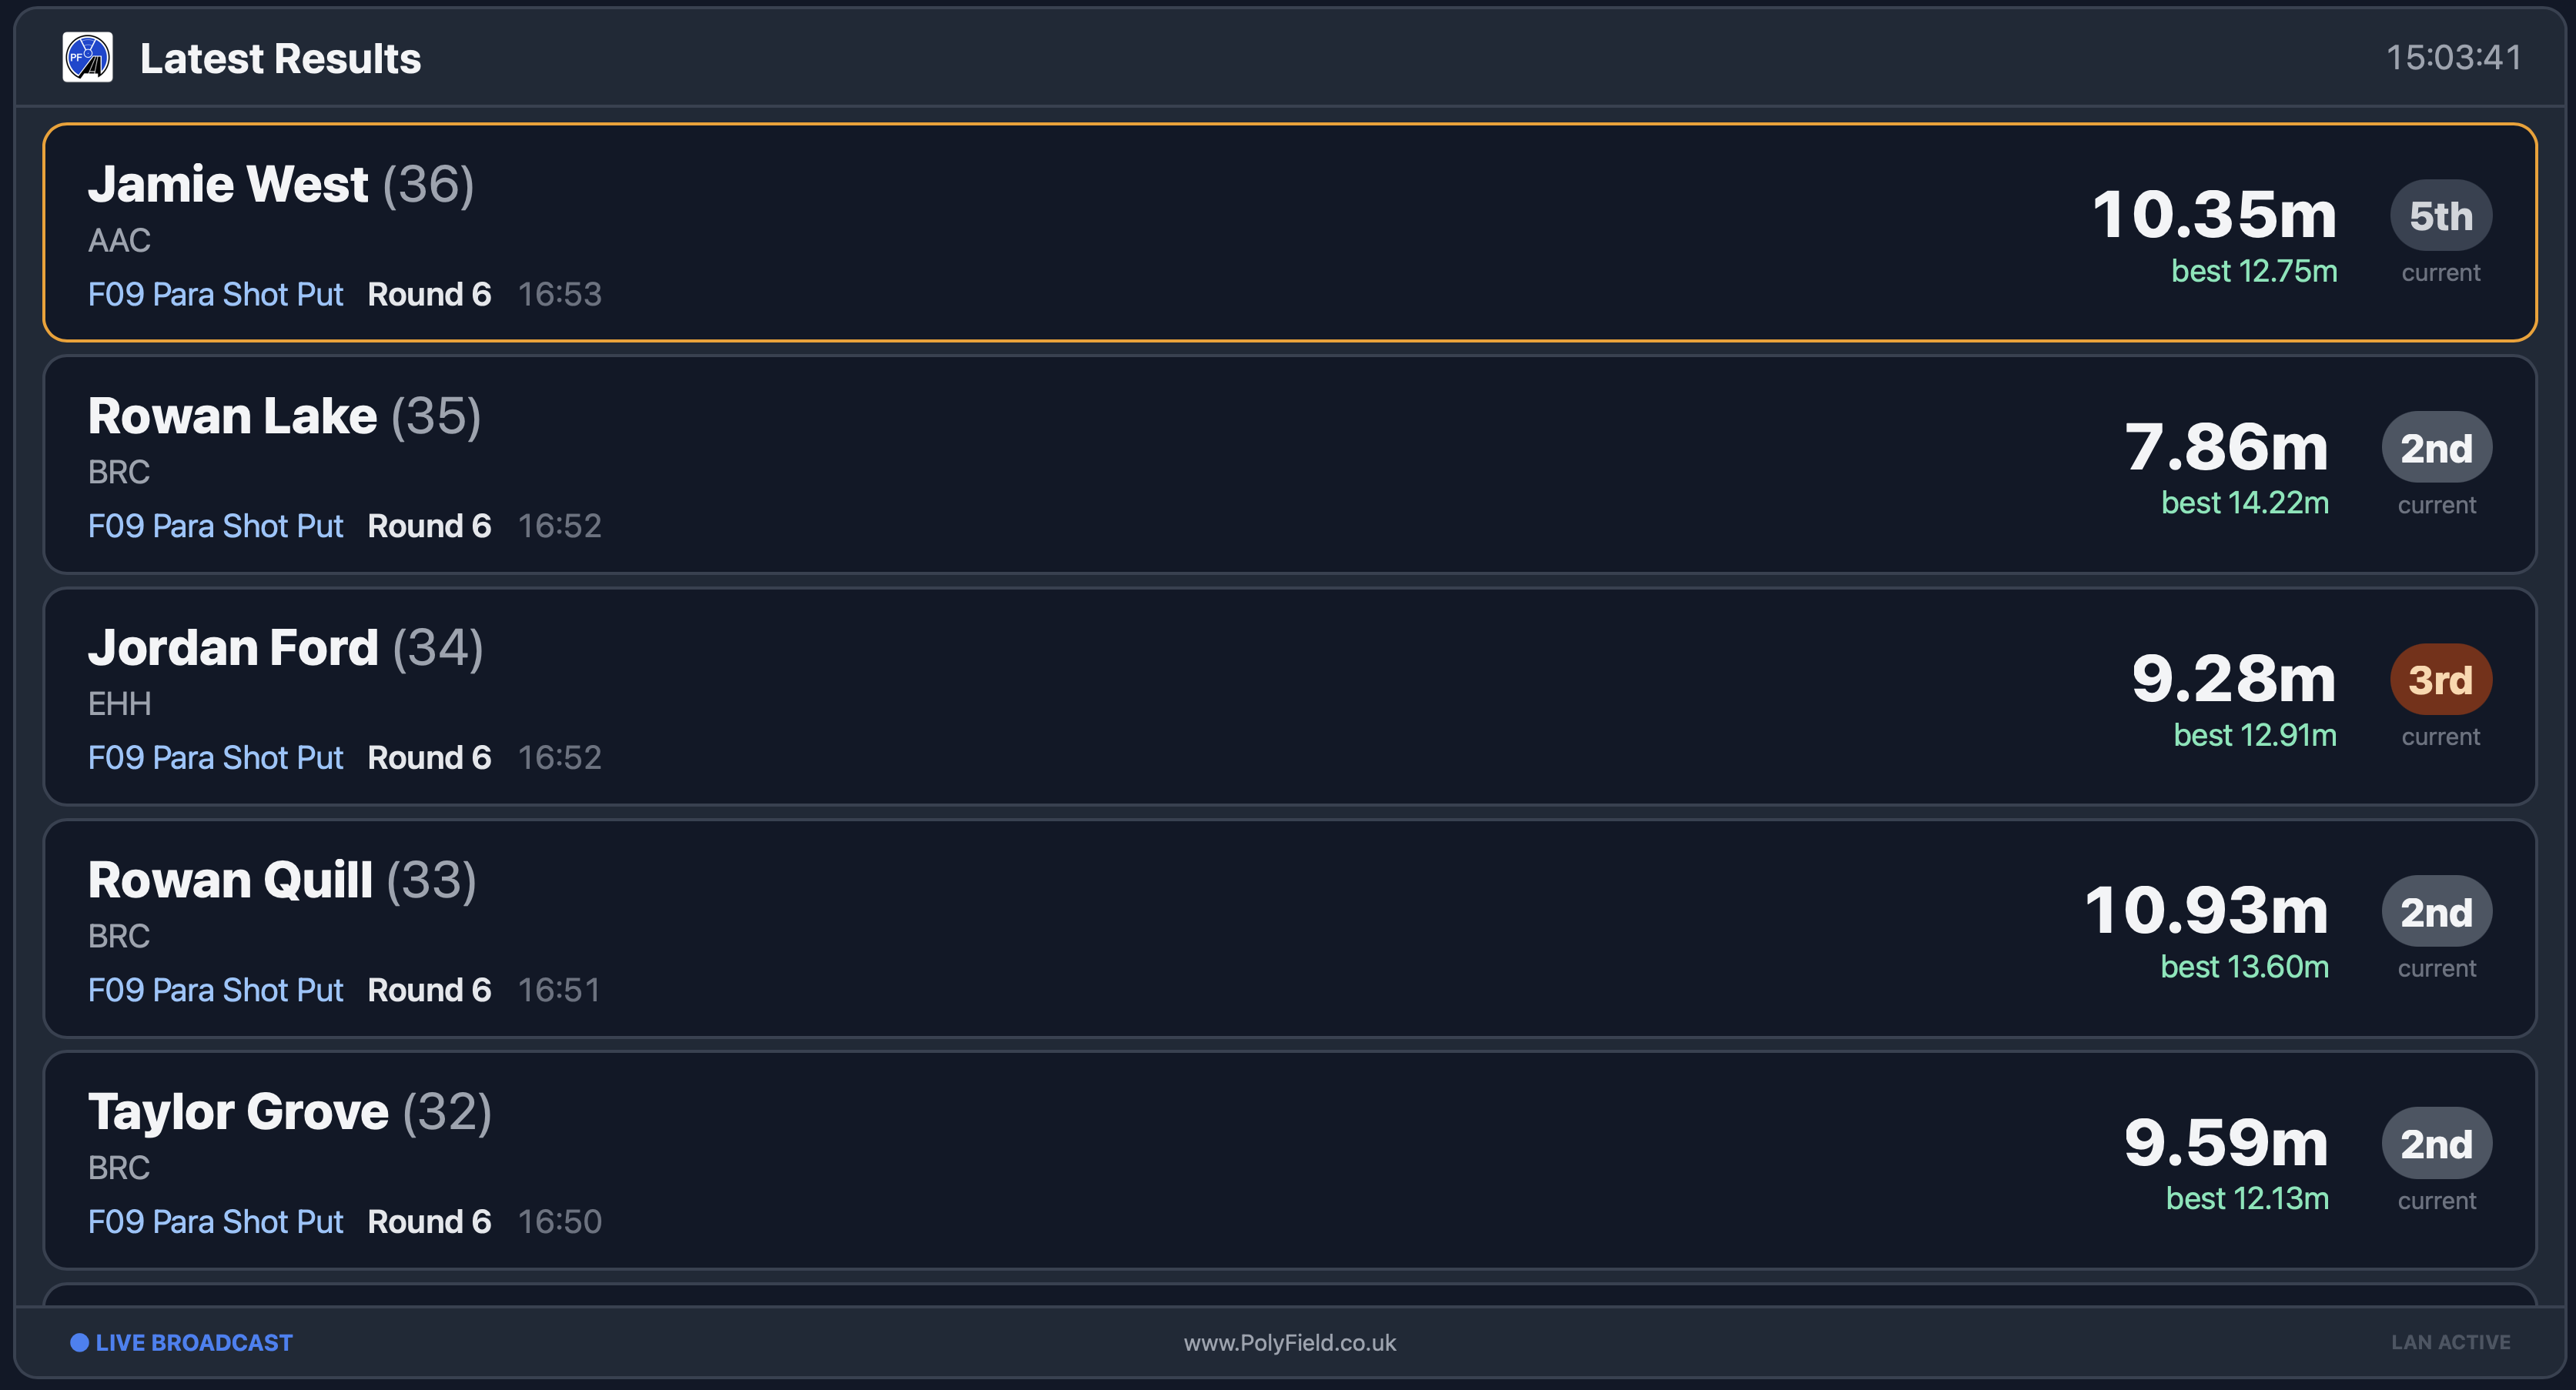
Announcer
A running feed of results as they arrive — the newest at the top, with position, athlete, club, event and mark — sized for an announcer or commentary position to read at a glance.
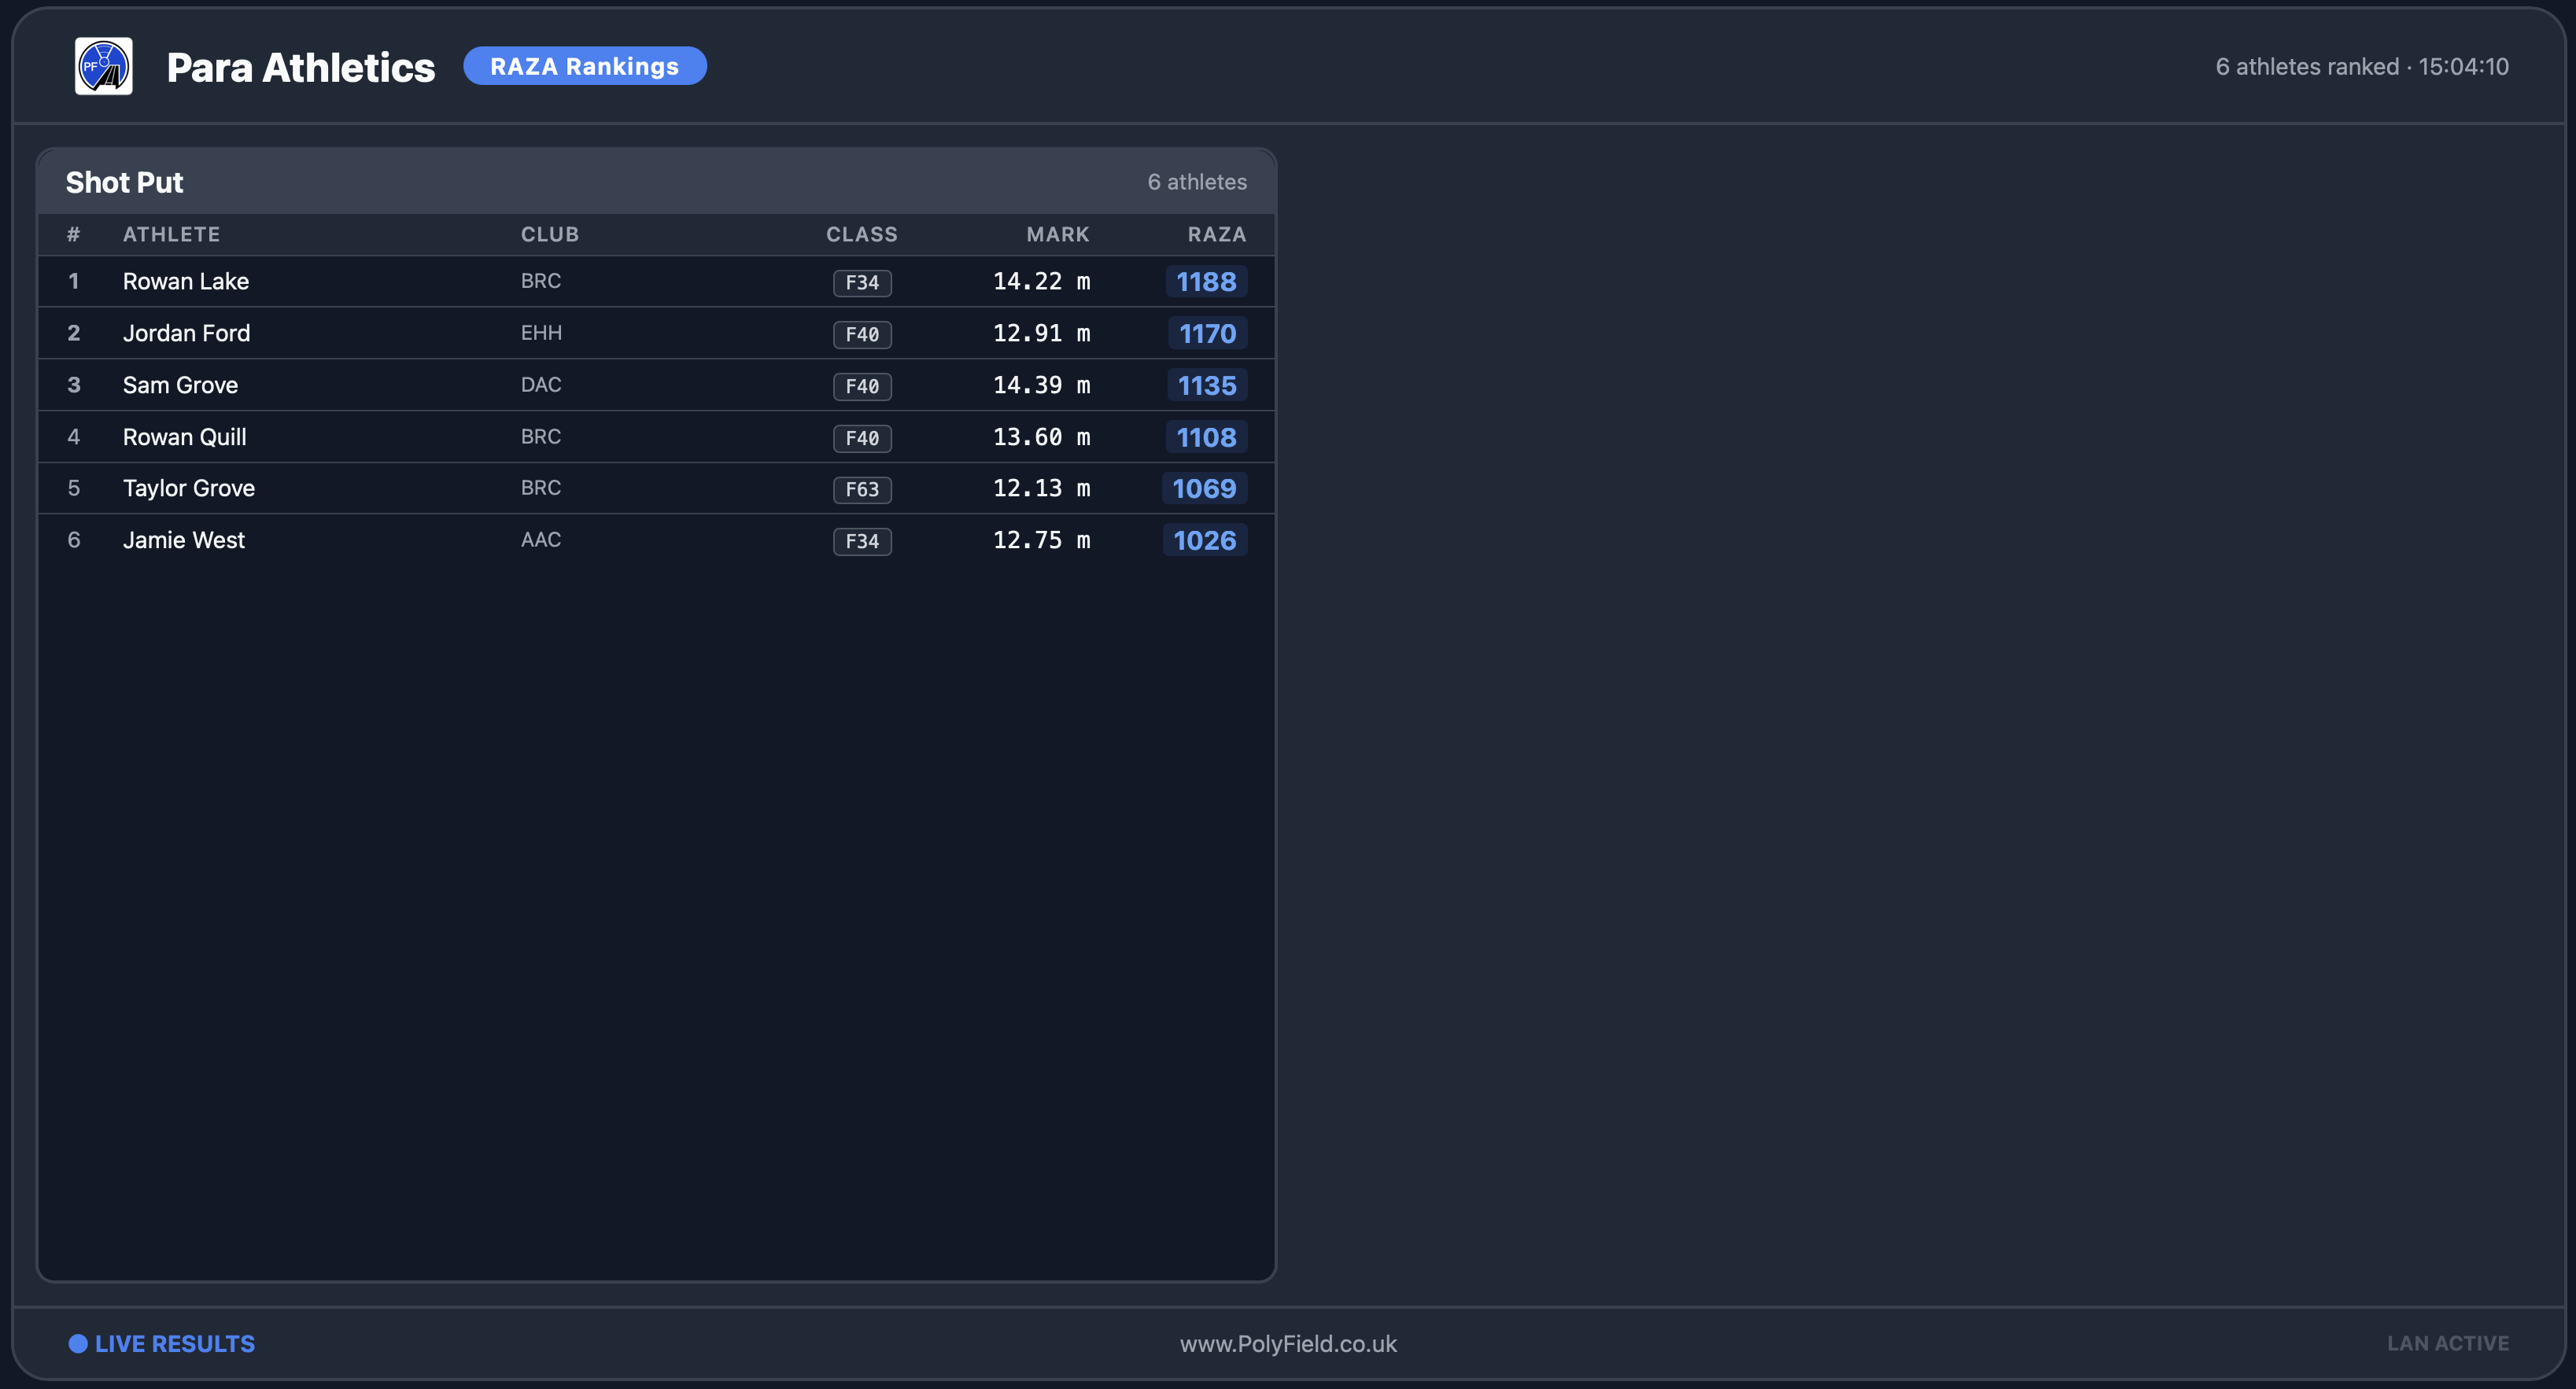
RAZA rankings
Para-athletics rankings scored with the World Para Athletics (RAZA) points system, so athletes across different classifications can be compared on one board. Athletes need a classification and gender set for a RAZA score to be calculated.
Wind gauges
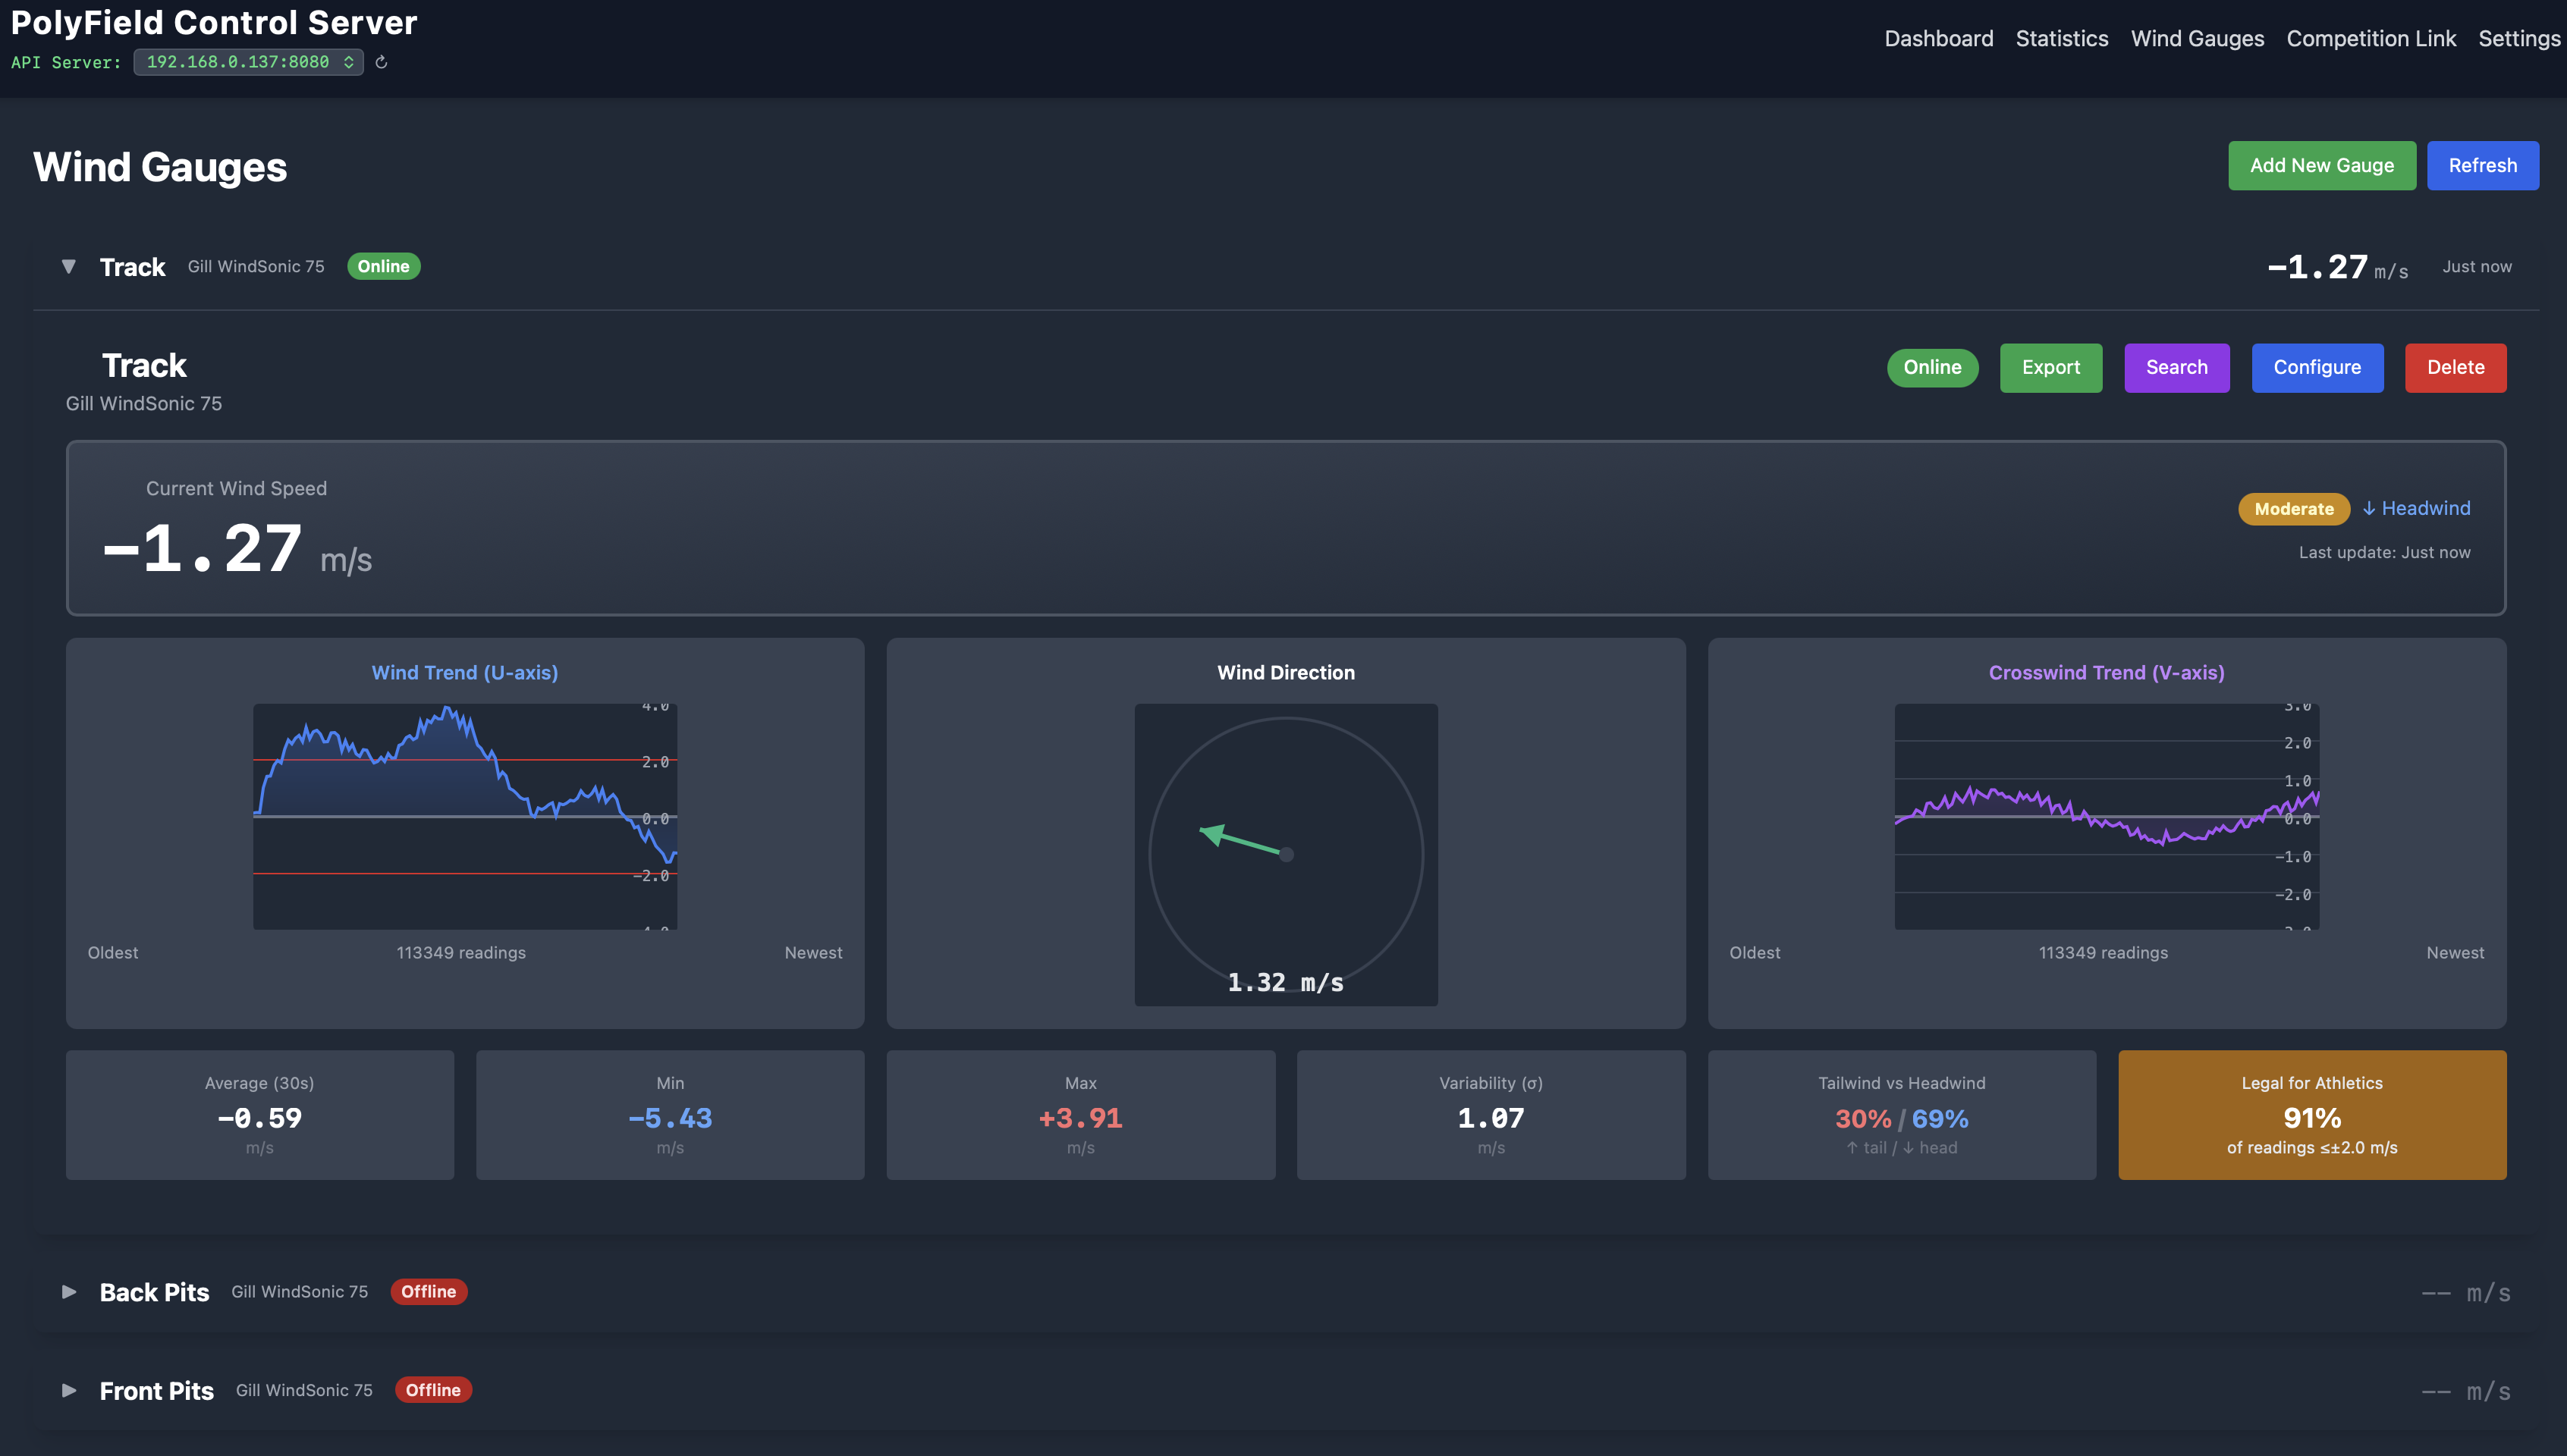
PolyField Server reads wind gauges over the network and records wind for the whole competition day. It supports the Gill WindSonic 75 and the PolyField Wind Mini, and detects the gauge type automatically from its data stream — there is no protocol to choose. Add a gauge with its network address; once it streams, the server shows the detected model and begins logging.
-
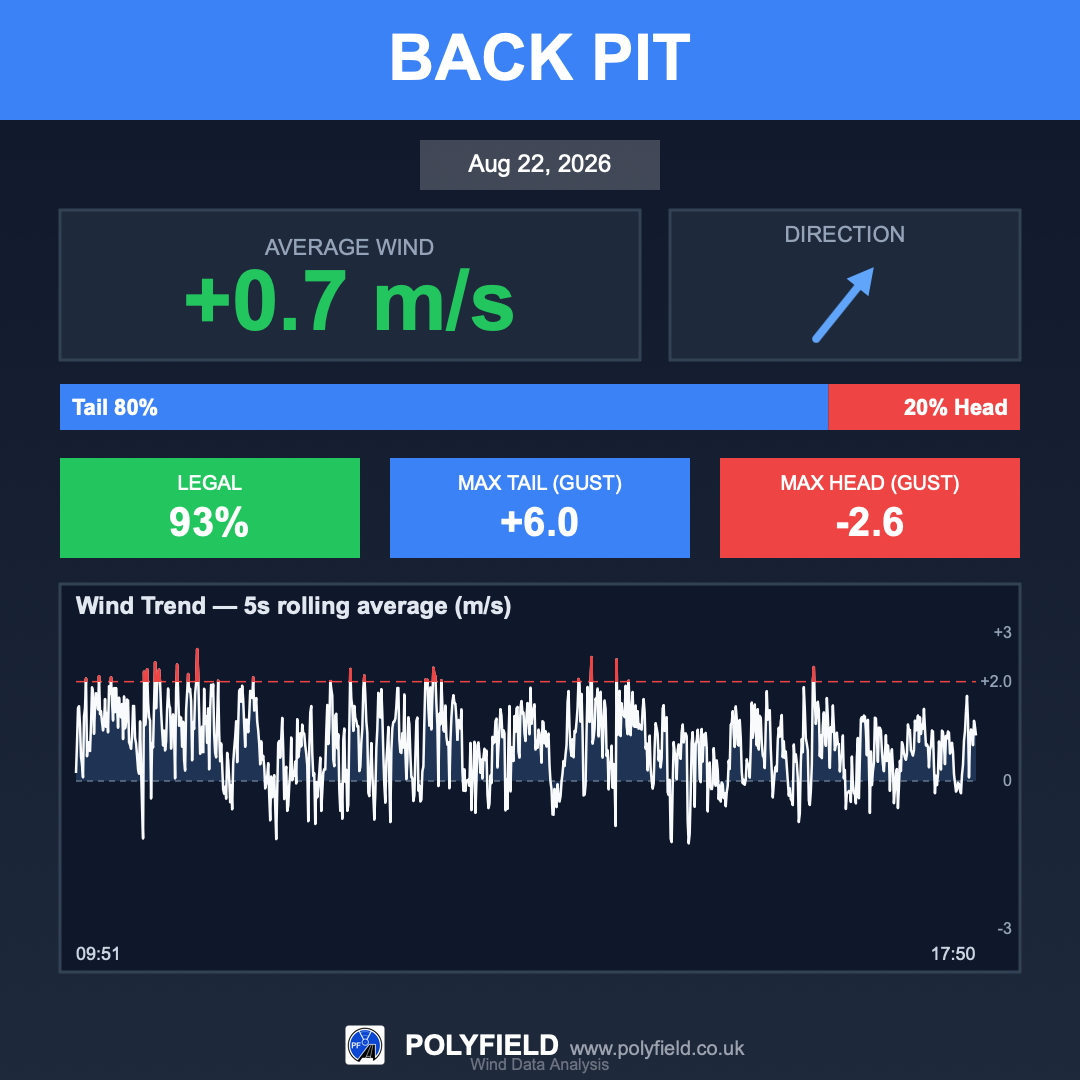
Wind is captured continuously and stored per day, so it is available for horizontal-jump legality, statistics and the wind graphics.
-
The Wind Gauges page shows each gauge live and lets you export a full-day wind graphic.
-
Gauges can be hidden from athlete selection (for example a general track gauge kept only for the record).
Statistics & heatmaps
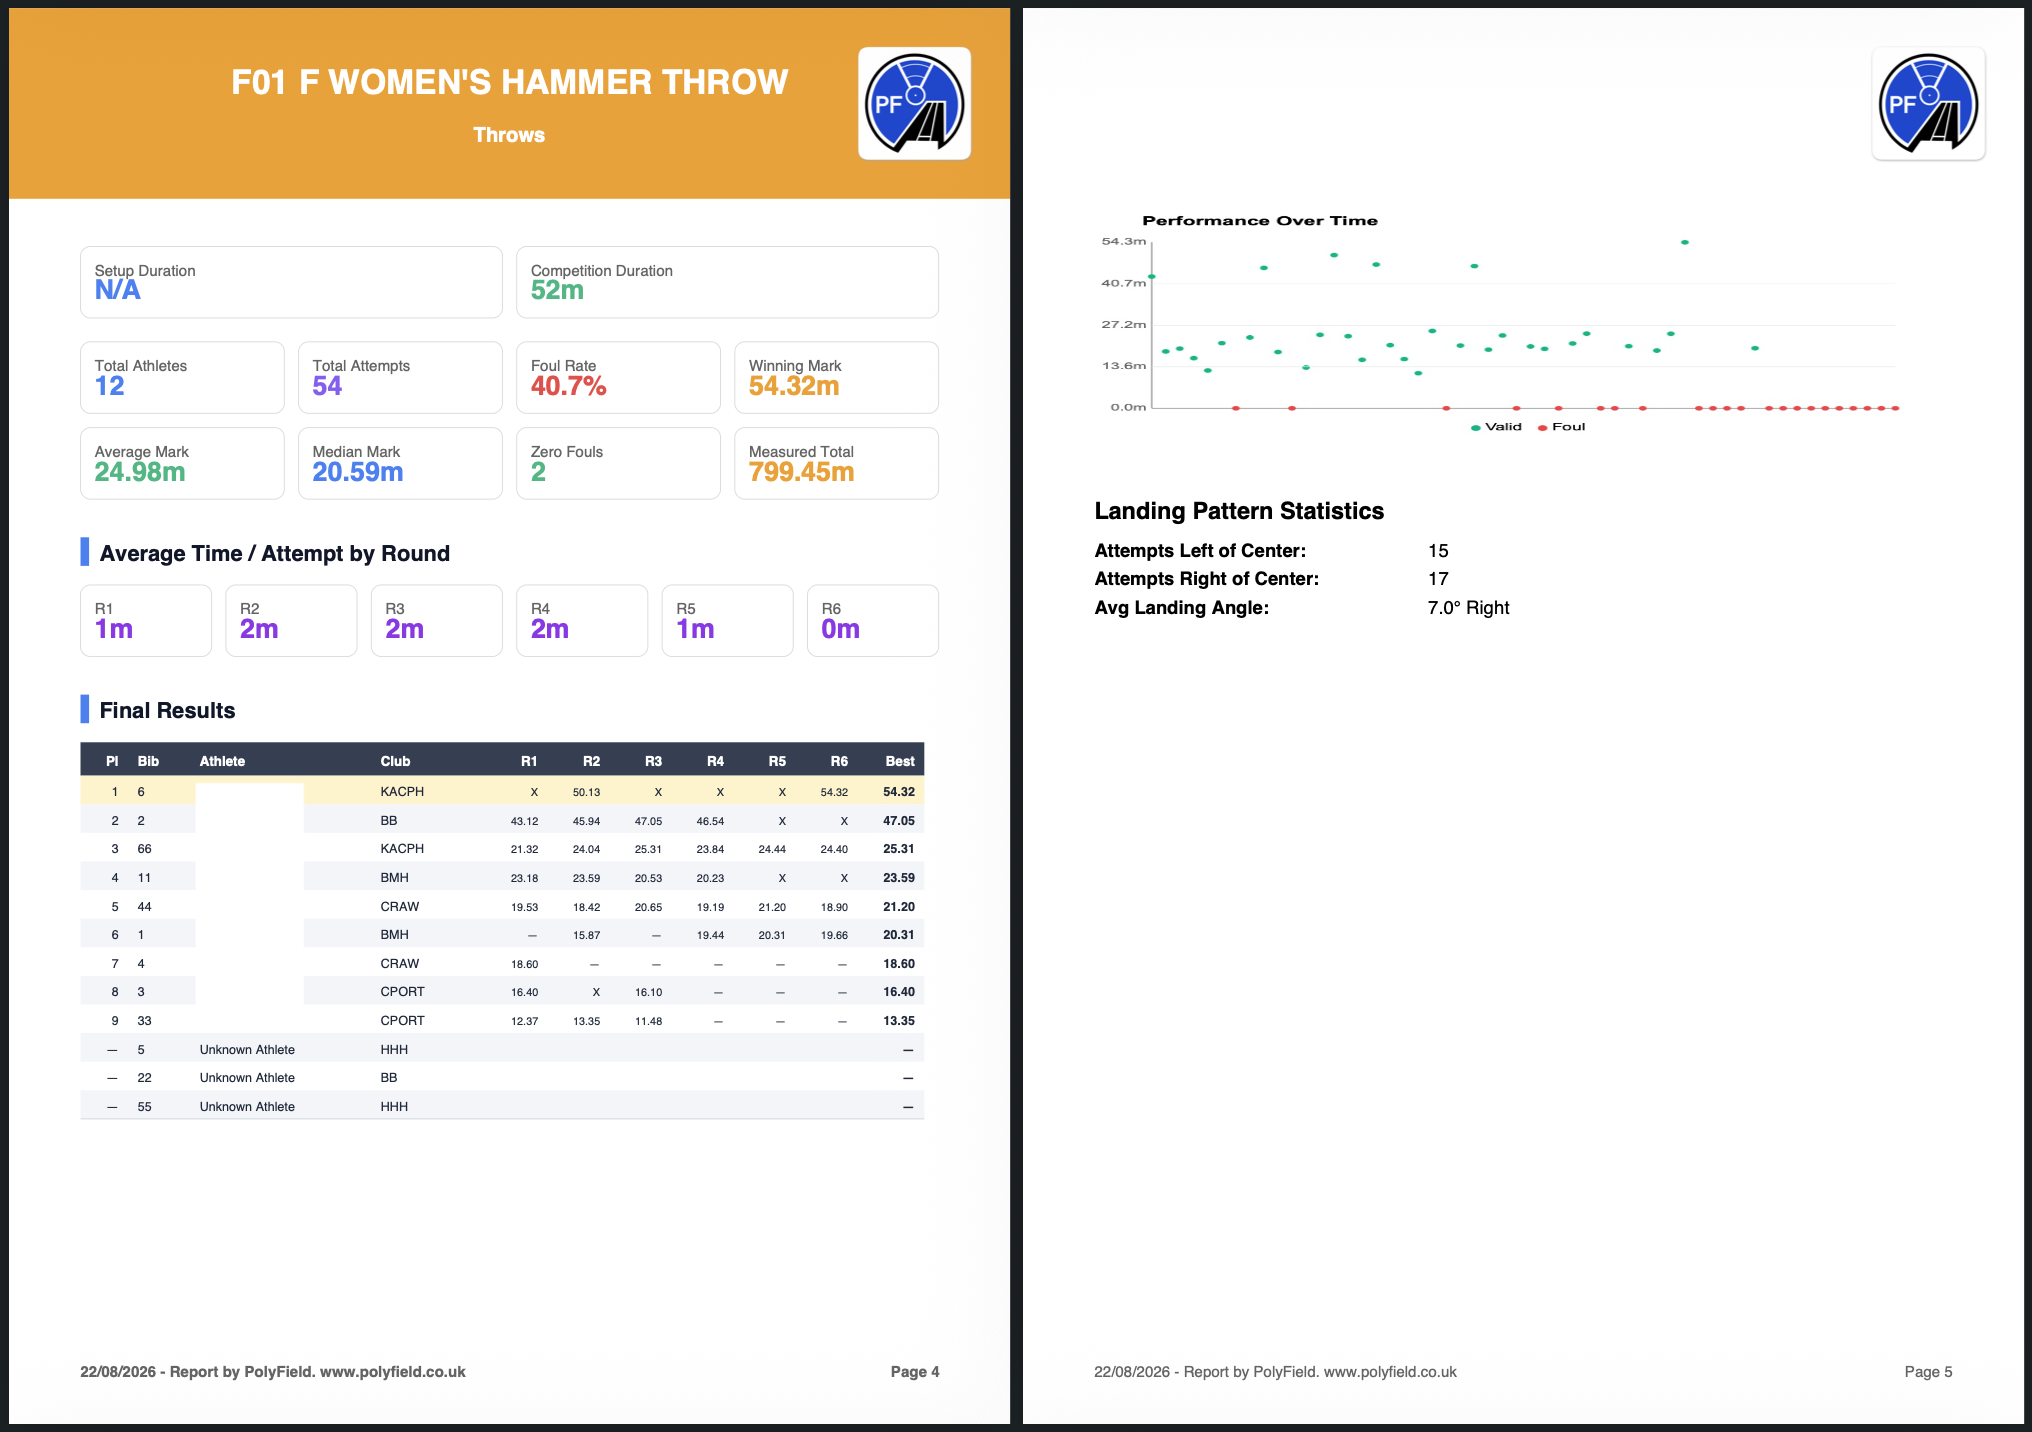
The Statistics page turns the competition data into analysis:
-
Per-event charts — performance over time, round-by-round comparison, foul rate and success, and timing between attempts.
-
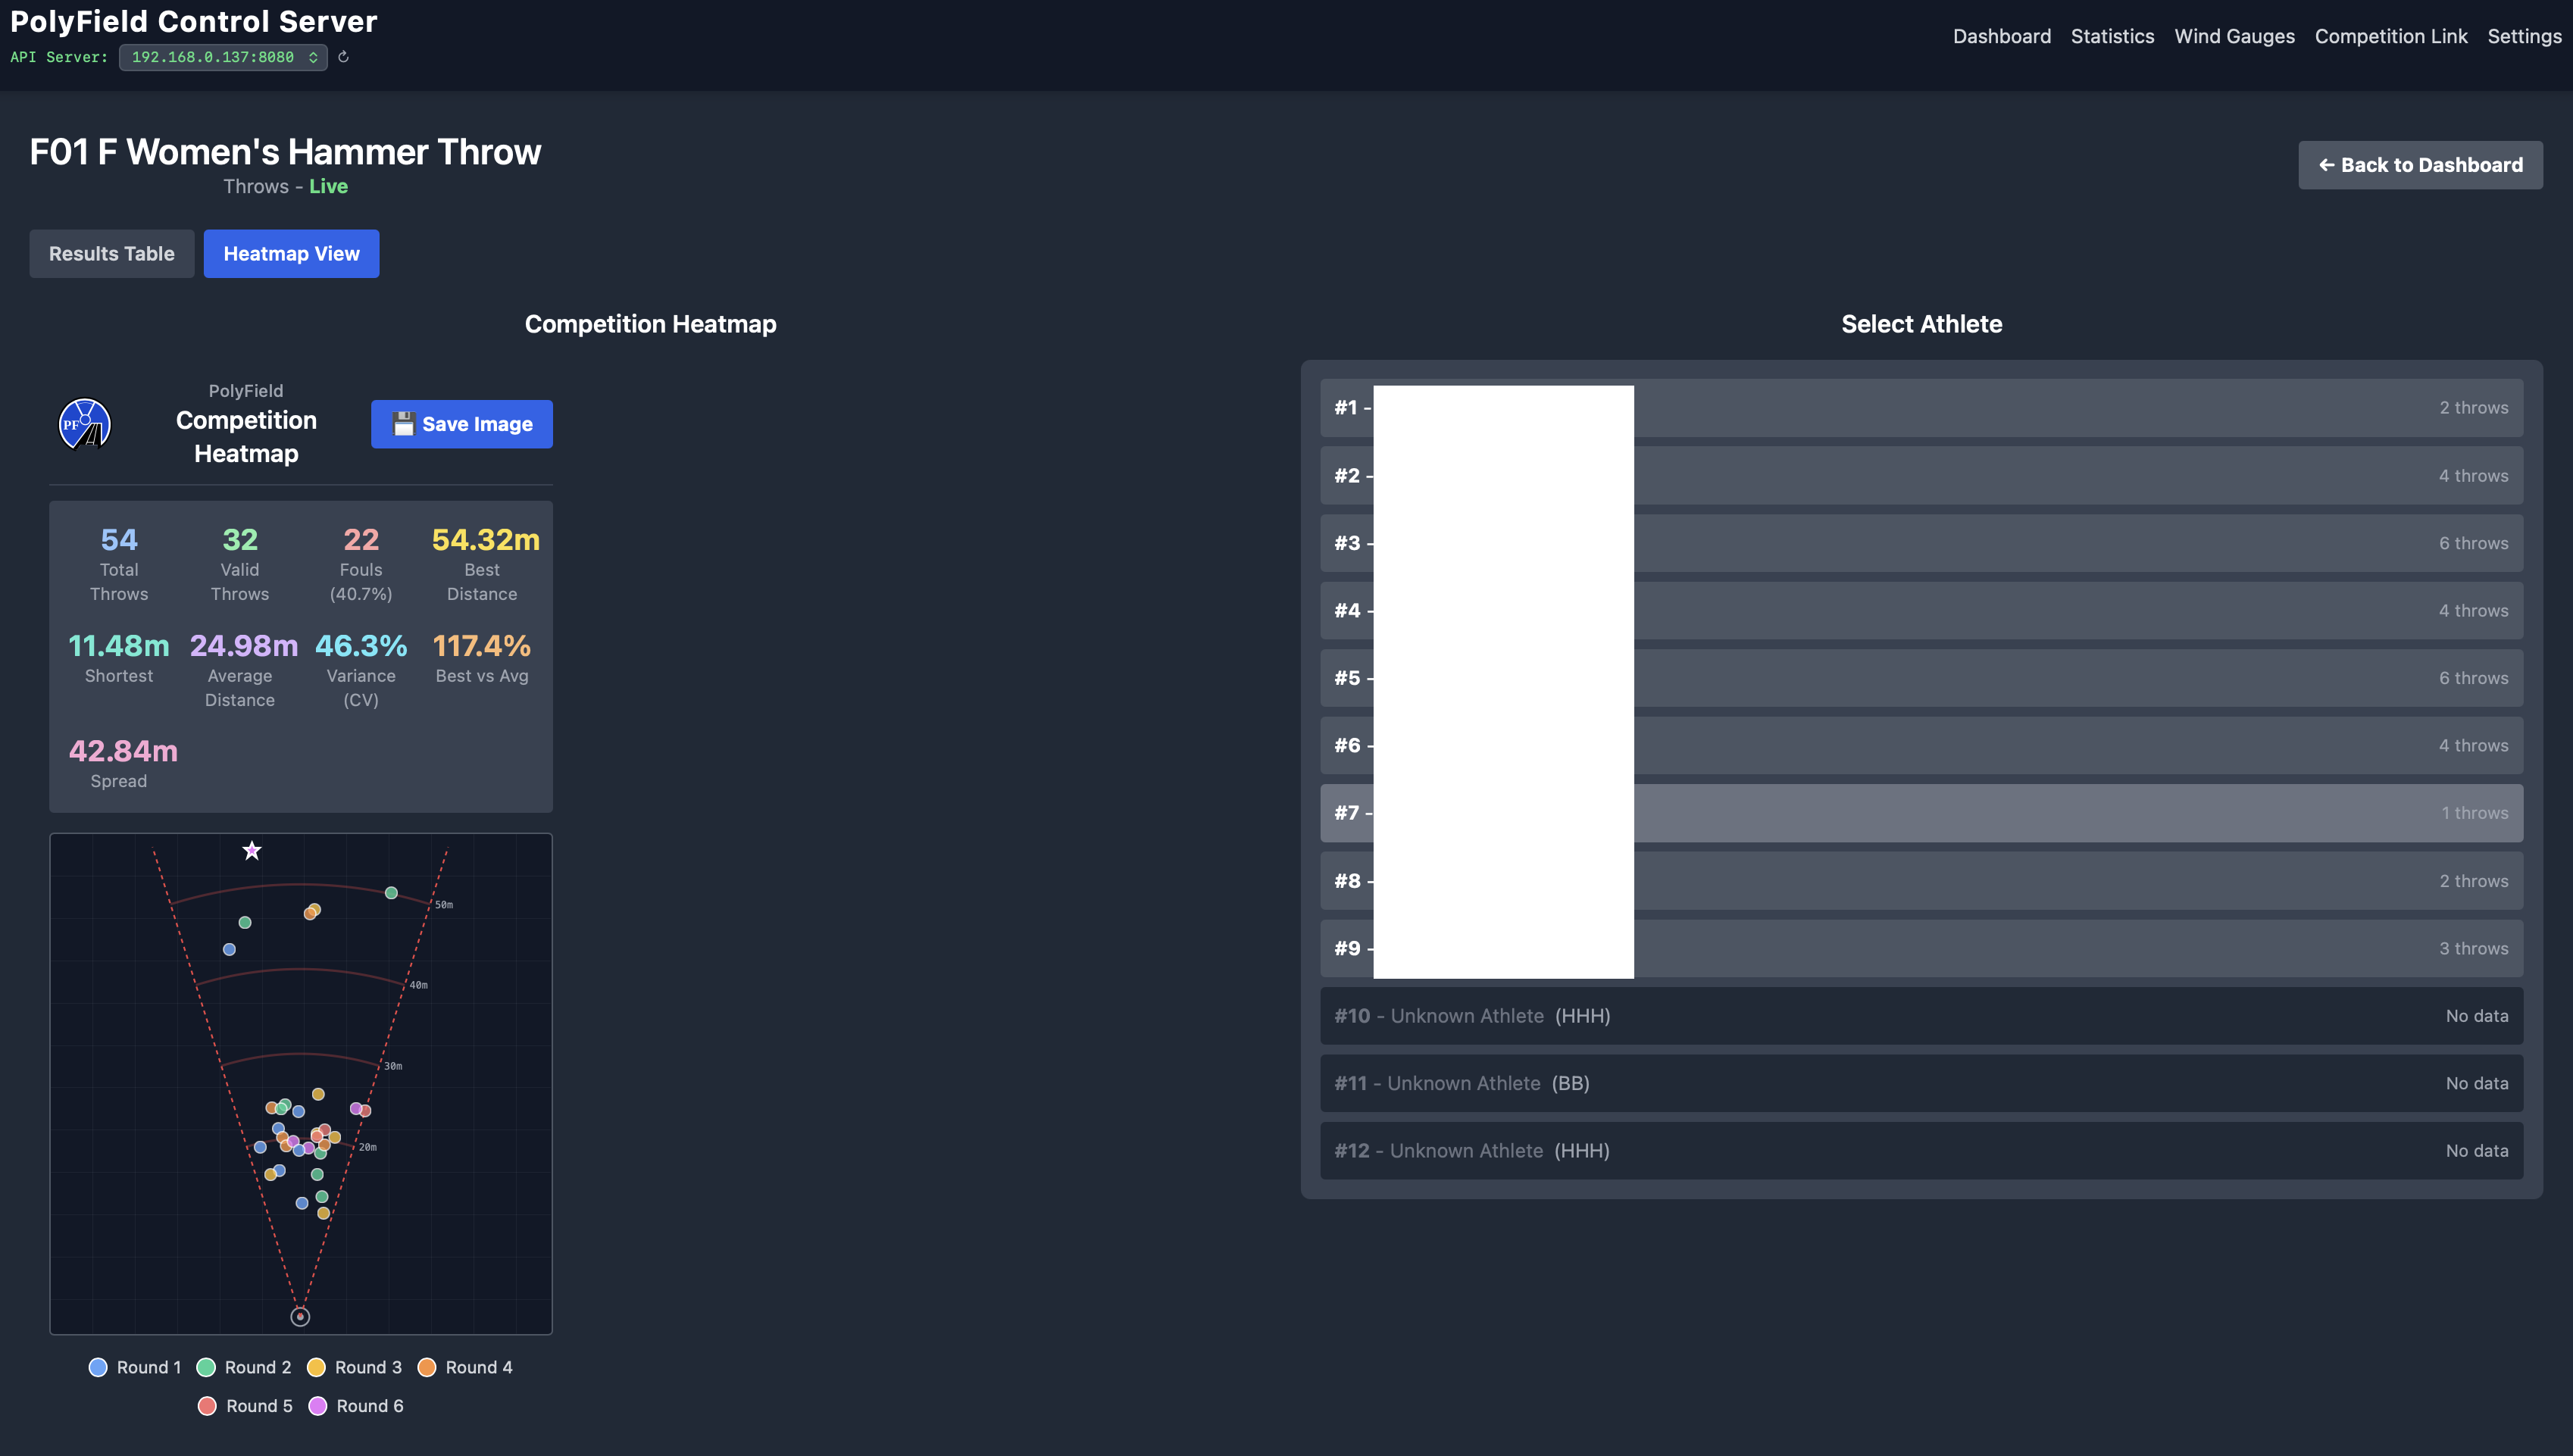
Landing heatmaps — for throwing events, every landing plotted in the sector, coloured by round, with the average landing angle relative to the sector centre line, spread and variance.
-
Wind — average, legality and the trend over the session for each gauge.
-
Export Statistics — a full competition PDF with the charts, heatmaps and per-event summaries, dated to the day of competition.
The charts and heatmaps scale with the display-size setting so they stay readable on the operator screen.
Social-media graphics
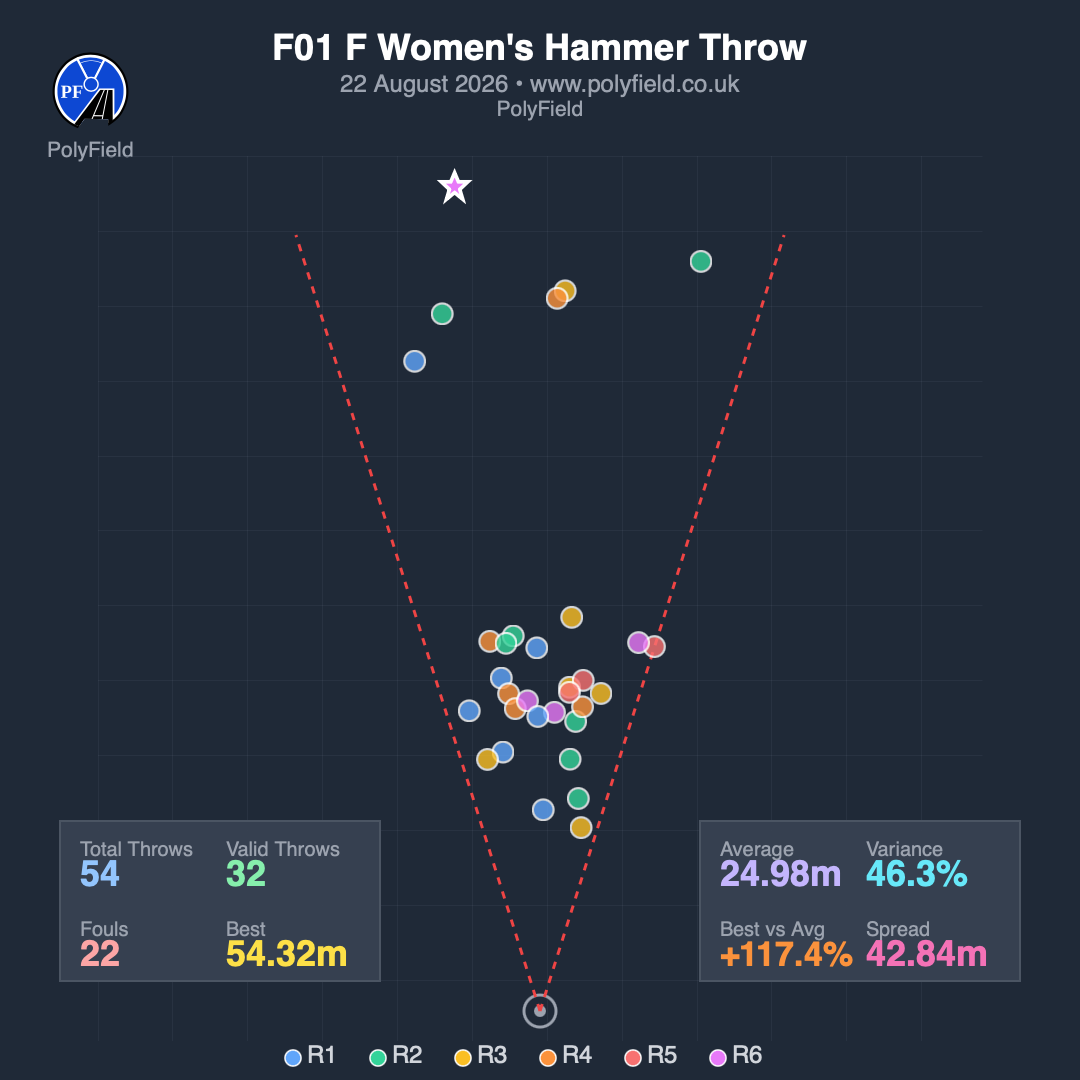
Export Graphics produces a set of square (1080×1080) images ready to post, all in one consistent PolyField style:
-
Competition summary — headline totals for the meet, with the longest throw and jump.
-
Per-event cards — the top three, event conditions and totals. Vertical-jump cards show each athlete’s clearance series at their best height and a 1st/2nd/3rd-attempt success-rate breakdown; horizontal-jump cards show the wind.
-
Detailed heatmaps — the full landing scatter for each throwing event.
-
Wind graphics — the full-day wind trend for each gauge, with legality and gusts.
Graphics are produced only for events that have run, and every card carries the competition date and PolyField branding.
Cloud results - In Trial
Optionally, the server publishes results to the PolyField cloud so spectators can follow along online at results.polyfield.co.uk. Two things can be uploaded, each toggled in Settings:
-
Athlete results & heatmaps — individual athlete pages anonymised to reduce identifiable information stored with their marks and a landing heatmap. These will auto-delete after 90 days.
-
Global heatmap — an aggregated landing picture across the competition. This is anonymised with no athlete individual data, it is held indefinitely.
Uploads are queued and retried, so a brief loss of internet does not lose data — the competition itself keeps running on the local network regardless.
Competition link
Competition Link is where you connect competition management providers to the server. The OpenTrack / Athletics.app import controls for loading the events.
Settings, display size & language
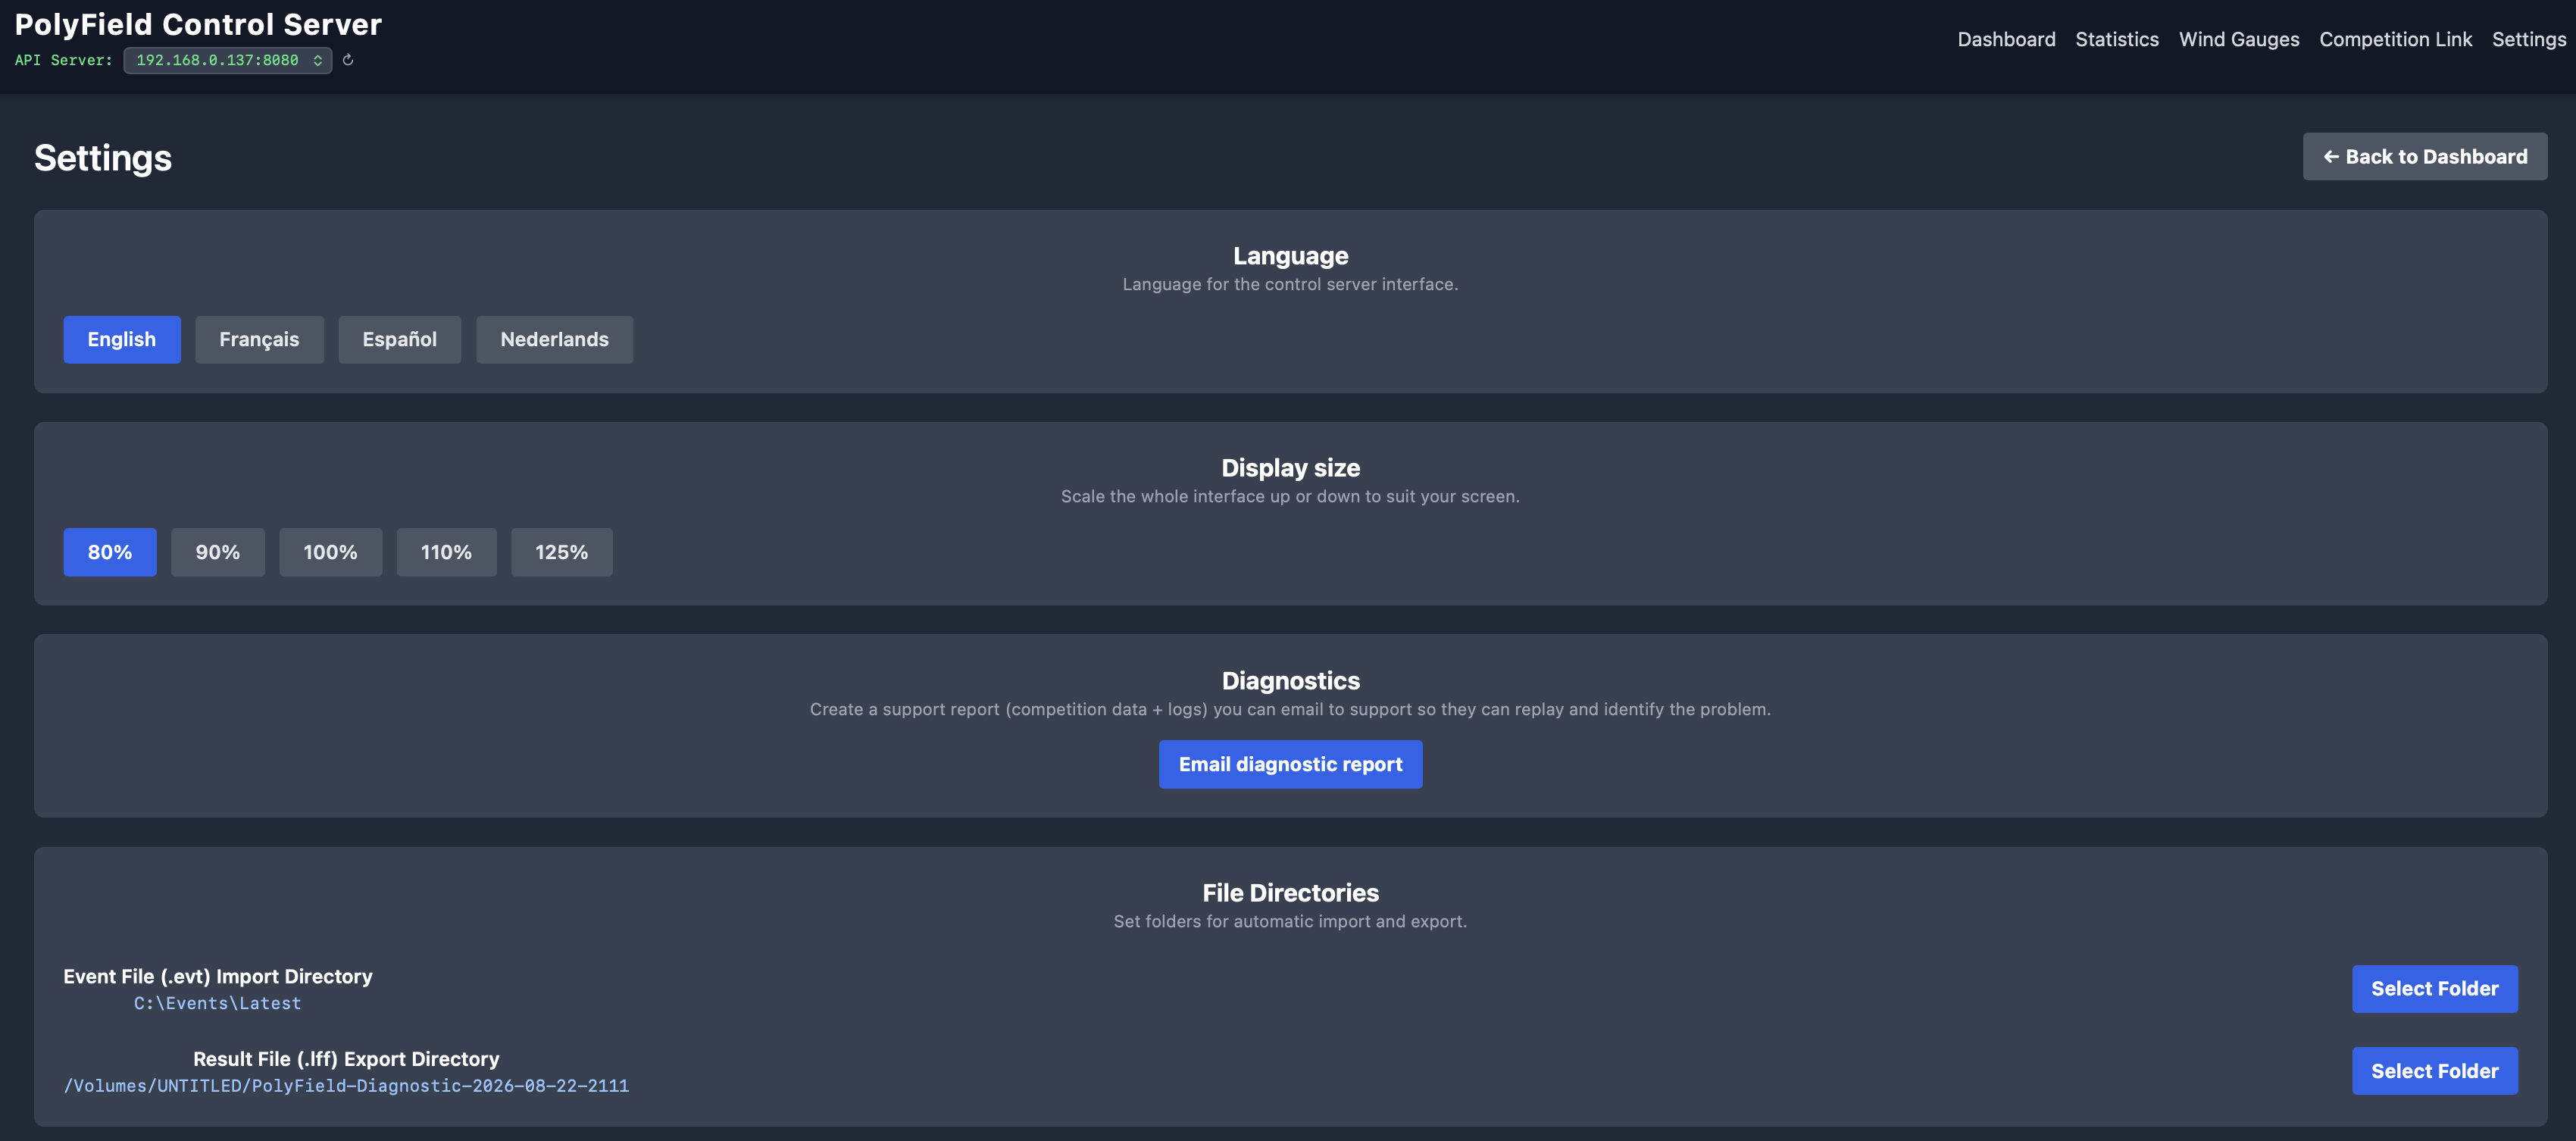
-
Display size — scales the operator interface, statistics charts and heatmaps to suit the screen you run the server on.
-
Language — the interface is available in English, French, Spanish, Dutch and Portuguese.
-
Cloud upload — enable or disable athlete and heatmap publishing.
-
Directories — set the folders used for event import, setting local PC backup folders, result and graphics export.
Networking
-
The app serves on port 8080 and advertises
polyfieldserver.local, so field devices and displays can usehttp://polyfieldserver.local:8080without the IP address. Some android devices require the full IP Address so you can also usehttp://192.168.0.10:8080replacing the 192.168.0.10 with the advertised server address in the Dashboard. -
On computers with more than one network adapter (common on Windows), pick the correct adapter at the top of the dashboard so the right address is advertised.
-
All devices — field apps and displays — must be on the same network as the host computer.
Diagnostics
If something goes wrong, use the diagnostic report. It bundles the current competition (which support can replay), the logs, and the day’s wind data into a single zip, and pre-fills an email to support@polyfield.co.uk. Attach the saved file before sending. The same bundle can be used to recover a competition if a machine has to be swapped mid-meet.

Troubleshooting
| Symptom | Check |
|---|---|
| A field device can’t connect | Confirm it is on the same network, port 8080 is reachable, and (multi-adapter PCs) the right network adapter is selected at the top of the dashboard. Ensure your firewall is not blocking the PolyField Server |
| An import returns 0 events | The source competition may have no entries yet, or a different competition is selected. Re-check the competition to ensure start lists have been published. |
| A display isn’t updating | The pages update themselves; if one is stale, reload it once. Confirm it is pointed at the current server address. The screens show a current time and “LIVE” text when connected to help verify. |
| A wind gauge shows no reading | Check the gauge’s network address and that it is powered and streaming; the model is detected automatically once data arrives. The wind gauge will show Online or Offline status on the Server. |
| RAZA board is empty | Athletes need a classification and gender set for a RAZA score to be calculated. |
| Results look out of order or a round is missing | Each result is timestamped by the field app; make sure the field devices are on the correct event and up to date. Verify the clock on the field device and server is correct, this can drift if used offline without an update. |
API reference
PolyField Server has an HTTP API on port 8080 under /api/v1. The field app and the display screens use it, and so can your own scoreboards, graphics or broadcast overlays. It is JSON over HTTP on the local network, with no authentication. Every endpoint, with request and response examples and its JSON Schema, is in the API reference; the full schema can be downloaded as one file.
| Method | Endpoint | Purpose |
|---|---|---|
| GET | /api/v1/events |
List all events |
| GET | /api/v1/events/{eventId} |
One event with athletes and every attempt |
| PUT / PATCH | /api/v1/events/status |
Set an event’s status |
| POST | /api/v1/results |
Send an athlete’s series (field app) |
| POST | /api/v1/athlete/active |
Signal who is up now (horizontal jumps) |
| GET | /api/v1/athlete/active/{eventId} |
Read who is up now |
| GET | /api/v1/display/recent |
Latest performances (display board) |
| GET | /api/v1/display/standings |
Standings for every event with marks |
| GET | /api/v1/broadcast/recent |
Last 10 results in full detail |
| GET | /api/v1/raza |
RAZA para-athletics rankings |
| GET | /api/v1/config |
Display language |
| GET | /api/v1/statistics/overall |
Competition-wide statistics |
| GET | /api/v1/statistics/event/{eventId} |
Statistics for one event |
| GET | /api/v1/wind/gauges |
Wind gauges and latest readings |
| GET | /api/v1/wind/current |
Average wind now |
| GET | /api/v1/wind/search |
Wind at a past moment |
| GET | /api/v1/stream |
Live update notifications (Server-Sent Events) |
Download & support
Download the latest version from www.polyfield.co.uk or the releases page. The app checks for updates on start-up and shows a banner when a newer version is available. Support: support@polyfield.co.uk.
API integration
PolyField Server exposes a simple HTTP + JSON API so other software on the venue network — scoreboards, broadcast graphics, custom display widgets or a results archive — can read the live competition and, where appropriate, feed data in. It is designed for the local network (LAN) only: the server listens on port 8080 at http://polyfieldserver.local:8080 (or the host’s IP, e.g. http://192.168.0.10:8080), plain HTTP, with no authentication — it trusts every device on the venue network. Keep that network private; do not expose port 8080 to the internet. Any WAN / internet-facing integration (reaching the server from outside the venue, or publishing beyond the cloud results already built in) needs a secured, authenticated path and must be discussed with us first — contact support@polyfield.co.uk before building against a public address.
All endpoints below are prefixed with /api/v1. Reads are GET, return application/json, and update the instant results land. To stay live, open the Server-Sent Events stream GET /api/v1/stream and re-read the feed you care about whenever it emits an update event (or poll every second or two).
| Method | Path | Purpose |
|---|---|---|
| GET | /api/v1/events |
List all events (id, name, type) |
| GET | /api/v1/events/{id} |
Full event: athletes, every attempt, calibration, sign-off |
| GET | /api/v1/broadcast/recent |
The last 10 attempts, newest first, with landing coordinates |
| GET | /api/v1/display/standings |
Ranked standings for every event |
| GET | /api/v1/athlete/active/{eventId} |
Current horizontal-jump jumper: board + best marks |
| GET | /api/v1/stream |
Live update signal (Server-Sent Events) |
| POST | /api/v1/results |
Submit an athlete’s attempts (the field app’s ingest) |
| POST | /api/v1/athlete/active |
Announce the current horizontal-jump jumper |
Marks are strings so they can carry non-numeric outcomes: a distance/height like "54.37", or "NM" (no mark / foul), "X" (failed height), "P"/"-" (pass). wind is a string in metres per second (e.g. "+1.2") or absent. Throw coordinates carry both the raw landing (x, y) and the rotated, circle-centre-relative rx/ry in metres.
Events list
GET /api/v1/events
[
  { "id": "T01", "name": "F09 O Discus Throw", "type": "Throws" },
  { "id": "T02", "name": "F03 O Long Jump", "type": "Horizontal Jumps" }
]
type is one of Throws, Horizontal Jumps or Vertical Jumps.
Full event detail
GET /api/v1/events/{id}
{
  "id": "T01",
  "name": "F09 O Discus Throw",
  "type": "Throws",
  "status": "In Progress",
  "rules": { "attempts": 6, "cutEnabled": false, "cutQualifiers": 0 },
  "signedOff": true,
  "signedOffBy": "A. Referee",
  "signedOffAt": "2026-09-24T17:55:00+01:00",
  "calibrationMetadata": {
    "circleType": "DISCUS",
    "circleRadius": 1.25,
    "sectorLines": { "rightLine": { "x": 6.18, "y": 19.64 }, "leftLine": { "x": -6.18, "y": 19.64 }, "sectorAngle": 34.92 }
  },
  "athletes": [
    {
      "bib": "1", "order": 1, "name": "Dillon Claydon", "club": "Blackheath & Bromley HAC",
      "series": [
        {
          "attempt": 1, "mark": "54.37", "unit": "m", "valid": true, "wind": null,
          "coordinates": { "x": -1.54, "y": 19.08, "distance": 54.37, "round": 1, "attempt": 1, "valid": true, "rx": 1.68, "ry": 55.61 }
        }
      ]
    }
  ]
}
Latest results feed
GET /api/v1/broadcast/recent — the 10 most recent attempts, newest first.
{
  "results": [
    {
      "eventId": "T01", "eventName": "F09 O Discus Throw", "eventType": "Throws",
      "athleteBib": "1", "athleteName": "Dillon Claydon", "athleteClub": "Blackheath & Bromley HAC",
      "athleteBest": "55.80", "attempt": 3, "mark": "55.80", "unit": "m", "wind": null, "valid": true,
      "timestamp": "2026-09-24T17:54:44+01:00",
      "sectorLines": { "rightLine": { "x": 6.18, "y": 19.64 }, "leftLine": { "x": -6.18, "y": 19.64 }, "sectorAngle": 34.92 },
      "coordinates": { "x": 41.7, "y": -36.5, "distance": 55.80, "round": 3, "attempt": 3, "valid": true, "rx": 0.90, "ry": 57.04 }
    }
  ]
}
Vertical jumps use height and attemptsAtHeight (e.g. "XXO") instead of a distance; horizontal jumps carry wind; throws carry sectorLines + coordinates.
Standings
GET /api/v1/display/standings
{
  "events": [
    {
      "id": "T01", "name": "F09 O Discus Throw", "type": "Throws",
      "athletes": [
        { "position": 1, "name": "Dillon Claydon", "club": "…", "bestMark": "55.80", "unit": "m", "wind": null }
      ]
    }
  ]
}
Current horizontal-jump jumper
GET /api/v1/athlete/active/{eventId} — who is up now for a long/triple jump event, for a take-off-board ruler display. Returns {"active": null} between athletes.
{
  "active": {
    "eventId": "T02", "athleteBib": "11", "athleteName": "Jack Gunnell",
    "board": 0, "topPerformances": [7.34, 7.28, 7.12],
    "updatedAt": "2026-09-24T17:39:40+01:00"
  }
}
board is the take-off board in metres — 7, 9, 11 or 13 for triple jump; 0 is the long-jump board. topPerformances are the athlete’s best legal marks so far in that event, best first, at most three.
Live updates (stream)
GET /api/v1/stream is a Server-Sent Events stream, not a JSON body. On connect it sends a comment line, then a plain update message every time competition data changes, plus keep-alive pings on an idle connection. Treat any update as “something changed — re-read whichever feed you display”.
: connected

data: update

: ping
Consume it with a standard EventSource (browser) or any SSE client; there is no payload to parse — the update token is the whole signal.
Submitting data in
Two POST endpoints accept JSON. The field app uses both; third-party ingest should be agreed with us first.
POST /api/v1/results — an athlete’s attempts (the whole current series for that athlete; it replaces what the server holds):
{
  "eventId": "T01",
  "athleteBib": "1",
  "series": [
    { "attempt": 1, "mark": "54.37", "unit": "m", "valid": true, "wind": null }
  ],
  "heatmapCoordinates": [
    { "x": -1.54, "y": 19.08, "distance": 54.37, "round": 1, "attempt": 1, "valid": true }
  ],
  "calibrationMetadata": { "circleType": "DISCUS", "circleRadius": 1.25, "sectorLines": { "rightLine": { "x": 6.18, "y": 19.64 }, "leftLine": { "x": -6.18, "y": 19.64 }, "sectorAngle": 34.92 } }
}
POST /api/v1/athlete/active — a fire-and-forget “now jumping” signal (board in metres, 0 = long-jump board; topPerformances best first, ≤3):
{ "eventId": "T02", "athleteBib": "11", "athleteName": "Jack Gunnell", "board": 11.0, "topPerformances": [7.65, 7.42, 7.30] }
Both return 200 with a small JSON acknowledgement. The active-athlete state is transient (in memory only, cleared on restart); everything else is backed by the saved competition.